USDJPY sell updatethis is an update to yesterdays analysis.
since there was an OB cross on the stochastics indicator and a rejection of the 50% (equilibrium) zone the I hopped onto the trade at market order hoping to ride the wave down
JPYUSD trade ideas

Dollar to Weaken Against Yen Over Next 6 MonthsUSD/JPY is showing signs of a potential downtrend after failing to break above key resistance at 152.00. The pair has formed a double-top pattern on the weekly chart, with RSI divergence signaling weakening bullish momentum. A break below 150.00 could accelerate losses toward 145.00 (200-day MA) and possibly 140.00 over the next 6 months.
The US dollar may weaken as the Fed is expected to start cutting rates in late 2024/early 2025, while the BoJ could cautiously tighten policy if wage growth persists. Narrowing US-Japan yield differentials (10-year yields) would reduce JPY carry-trade appeal, supporting yen strength. MoF’s verbal warnings and past interventions near 152.00 suggest strong resistance to further yen weakness.
Sasha Charkhchian

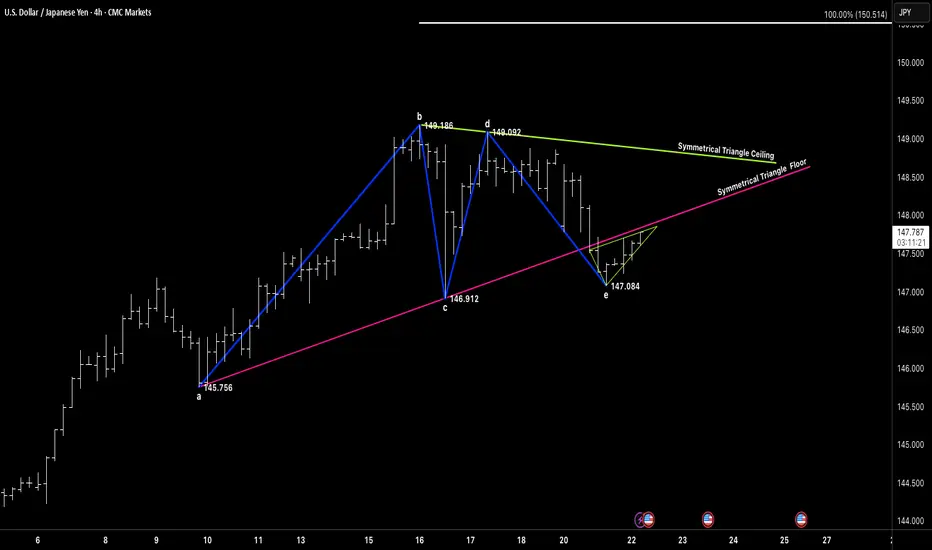
SYMMETRICAL TRIANGLEGood morning and good afternoon traders, wherever you're dialed in from.
Hope y’all are stacking those pips this week — whether you’re trend-riding, countering swings, or just sitting back letting setups come to you. 🔍
We’ve been hitting precise targets lately, and the tape’s been speaking loud and clear. Doesn’t matter what the sentiment says — we follow price, we follow structure.
Right now, we’ve got a clean symmetrical triangle unfolding on USDJPY (4H). Marked up from point a to e, with that little fakeout dip at E (147.084) acting like a trap for the impatient. Textbook spring behavior.
What catches my eye is the way price is coiling tight between the triangle’s ceiling and rising floor. We’re hovering just under 147.80, and a decisive push through that ceiling could unlock a sharp move toward the 150.50 zone (symmetrical projection).
If you missed the earlier leg, don’t chase — let price show you real intent. A confirmed breakout above 148.00 is the trigger. If we break back below 146.90, reassess.
No need to guess — we observe, we react. Let the market come to us.
“We don’t force trades. We trade when the market invites us.”
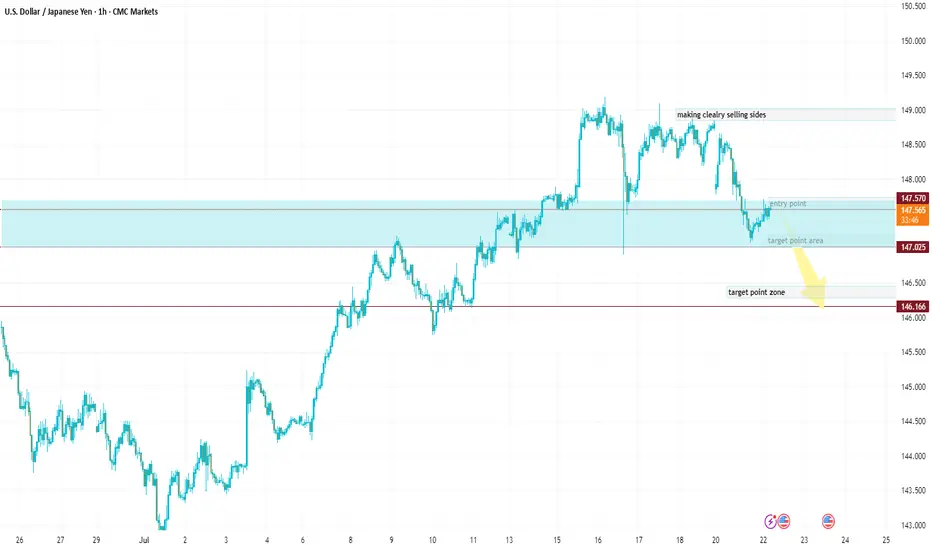
USDJPY Entry Zone: Current market is near your ideal entry zoneEntry Point (for Sell): Around 147.800 – 147.600
🔻 First Target (TP1): 147.050 – Labeled as "target point area"
🔻 Second Target (TP2): 146.300 – Labeled as "target point zone"
🛑 Invalid Zone (Sell Weakens): Above 148.600 – 149.000 (marked as “making clearly selling sides”)
Entry Zone:
Current market is near your ideal entry zone.
A pullback or rejection around 147.800 provides a good short opportunity.
🎯 Take-Profit Zones:
TP1: 147.050 (first support level / structure base)
TP2: 146.300 (major demand zone)
📉 Stop-Loss (SL):
Above 148.600
USDJPY (daily analysus) 24/07hi everyone the daily analysis video is up little early today before the daily candle close so this analysis might change is closes differently, but as is we are still bearish.
as always happy trading and have a great day

USDJPY Q3 | D21 | W30 | Y25 15' OB UPDATE 📊USDJPY Q3 | D21 | W30 | Y25 15' OB UPDATE
Daily Forecast 🔍📅
Here’s a short diagnosis of the current chart setup 🧠📈
Higher time frame order blocks have been identified — these are our patient points of interest 🎯🧭.
It’s crucial to wait for a confirmed break of structure 🧱✅ before forming a directional bias.
This keeps us disciplined and aligned with what price action is truly telling us.
📈 Risk Management Protocols
🔑 Core principles:
Max 1% risk per trade
Only execute at pre-identified levels
Use alerts, not emotion
Stick to your RR plan — minimum 1:2
🧠 You’re not paid for how many trades you take, you’re paid for how well you manage risk.
🧠 Weekly FRGNT Insight
"Trade what the market gives, not what your ego wants."
Stay mechanical. Stay focused. Let the probabilities work.
FRGNT 📊


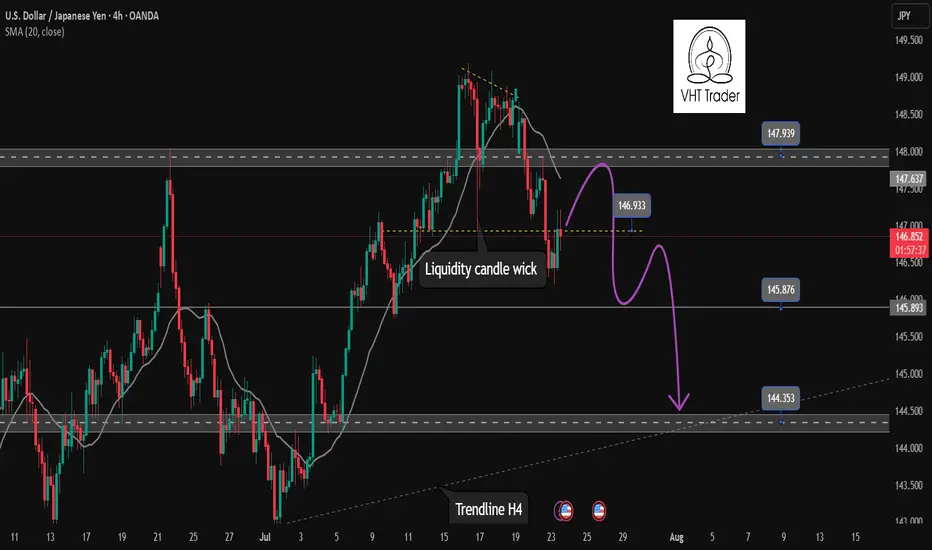
Continuation of downtrend. Waiting for confirmation SELL USDJPY✏️ OANDA:USDJPY is starting a corrective downtrend. Yesterday's New York session's selling pressure surpassed the buying liquidity zone around 147,000. This further confirms the possibility of the pair continuing its downward correction. Some recovery waves in today's Asia-Europe session are considered a good opportunity to SELL towards the target of 144,300 (trailline zone of the h4 frame). Pay attention to the important breakout price zone of 145,900.
📉 Key Levels
Support: 145,900-144,300
Resitance: 147,000-147,800
SELL trigger: Rejection from 147,000
SELL 147,700 (Strong resistance + SMA 20)
Target 144,400
SELL DCA: Break 145,900
Leave your comments on the idea. I am happy to read your views.
DXY, EURUSD & USDJPY Daily Trade SetupsIn this update we review the recent price action in the Dollar Index, Euro & Yen and identify the next high-probability trading opportunities and price objectives to target. To review today's video analysis, click here!

USD/JPY PROBABLY !Waiting for confirmation on candles and Real Volume 5min or 15min (power of Real Volume)-without real volume I am like a blind man in a dense forest :)
Tools:
- real volume (proper interpretation)
- Fibonacci expansion ABC (an additional, new goal every day)
- Fibonacci retracement (combined with the real volume, it shows me the real probable movement for the next hours and days)
- volume support and resistance levels (confirmation of the price recovery level)
- oversold/overbought index (focusing on 1H and 4H something is already overvalued or undervalued)
- candlestick patterns (my entry point for 5 minutes or 15 minutes candlestick formations confirmed by particularly increasing volume).

USDJPY is continuing its uptrend, let's BUY✏️ OANDA:USDJPY broke the price channel and continued its uptrend at 151,000. The previous h4 candle wick had a liquidity sweep to 147,000, showing that the buyers are dominating the market. The USDJPY trading strategy will mainly BUY to the old peak around 151,000. When the price breaks 147,000, a corrective downtrend will begin to form.
📉 Key Levels
Support: 148.200 - 147.200
Resistance: 150.100 - 151.100
Buy trigger: Breakout above 148,800
BUY 147,200 (buyer liquidity zone)
Target: 145,000
Leave your comments on the idea. I am happy to read your views.

Thanks to Trump, time to short USDJPYLatest news here
You can either LONG the Nikkei 225 CFD or short the USDJPY.
As usual, please DYODD
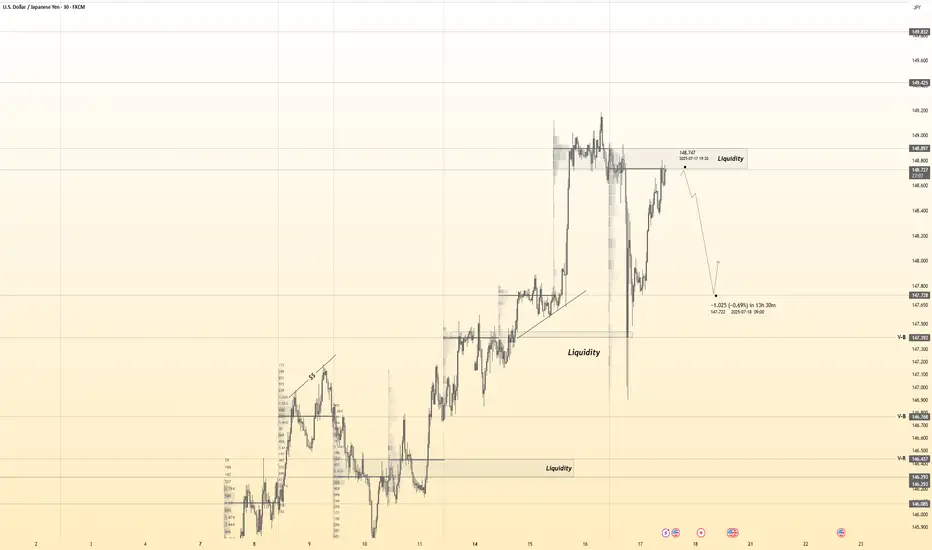
USDJPY 30Min Engaged ( Bearish Entry Detected )————-
➕ Objective: Precision Volume Execution
Time Frame: 30-Minute Warfare
Entry Protocol: Only after volume-verified breakout
🩸 Bearish From now Price :148.750
➗ Hanzo Protocol: Volume-Tiered Entry Authority
➕ Zone Activated: Dynamic market pressure detected.
The level isn’t just price — it’s a memory of where they moved size.
Volume is rising beneath the surface — not noise, but preparation.
🔥 Tactical Note:
We wait for the energy signature — when volume betrays intention.
The trap gets set. The weak follow. We execute.
USDJPY M SIBI SELL SHORTUSDJPY M SIBI SELL SHORT
- Market in Monthly TF market is bearish
- Market in weekly TF is bullesh
- Market in Daily TF fully bullesh
- IN Monthly SIBI when market is present on our AOI then shift to LTF
find a Valid Market Structurer Shift with Valid OBI / LTF SIBI / BPR ,
- when market is in our OBI / LTF SIBI / BPR after Liquidity Swap then Entry in our AOI
with proper Tight SL with Open Target for a big Movement Catch . Partly Profit book our nearest HTF Liquidity .....
********************Enjoyyyyyyyyyyyyyyyyyyyyyyyyy
KGB Priyabrat Behera
ICT Trader & Advance Mapping SMC Trader

USDJPY| Bullish Bias - Mitigated OB, Waiting for LTF ConfirmsPair: USDJPY
Bias: Bullish
Price swept deeper liquidity and has now mitigated a key 30M bullish order block.
From the 2H bird’s eye view, structure is still aligned to the upside — but I remain in analysis mode until LTF confirms the shift.
No need to force anything — price is doing its job, and I’m waiting for it to speak clearly through confirmation.
Bullish structure still in play, but we wait for the perfect moment.
#USDJPY #SMC #bullishbias #orderblock #structuretrader #inducementking
Bless Trading!

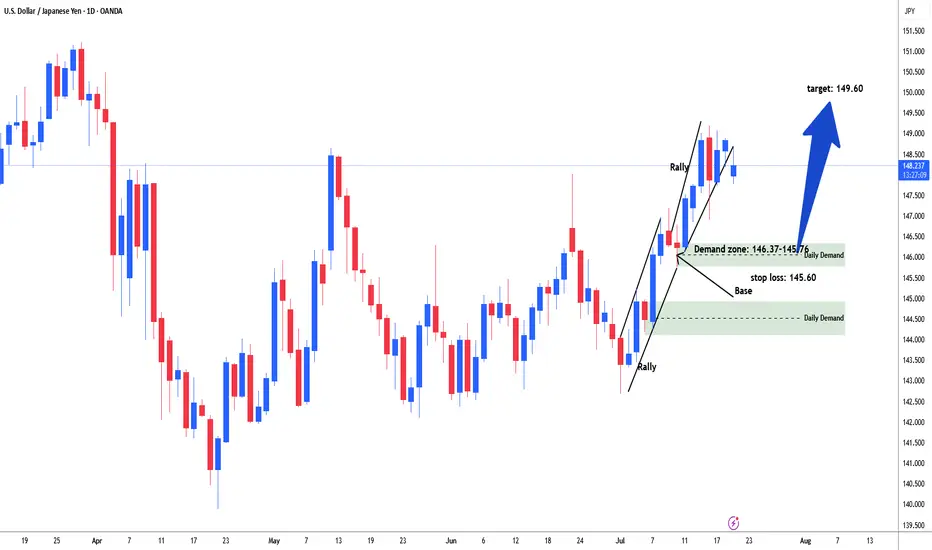
USDJPY Possible long for 149.60#usdjpy started rally from the start of the month of July. Price consolidate in range between 142.85-10. Then started rally. price again consolidate in range between 147.15-145.76 area. Market build energy and institutional add further longs and broke above the daily resistance line 148.60. Need to sell off / retracement to test demand zone range 146.37-145.78 area to test and filled remaining institutional orders for long. Buying area 146.37-145.76. stop loss: 145.60. Target: 149.60
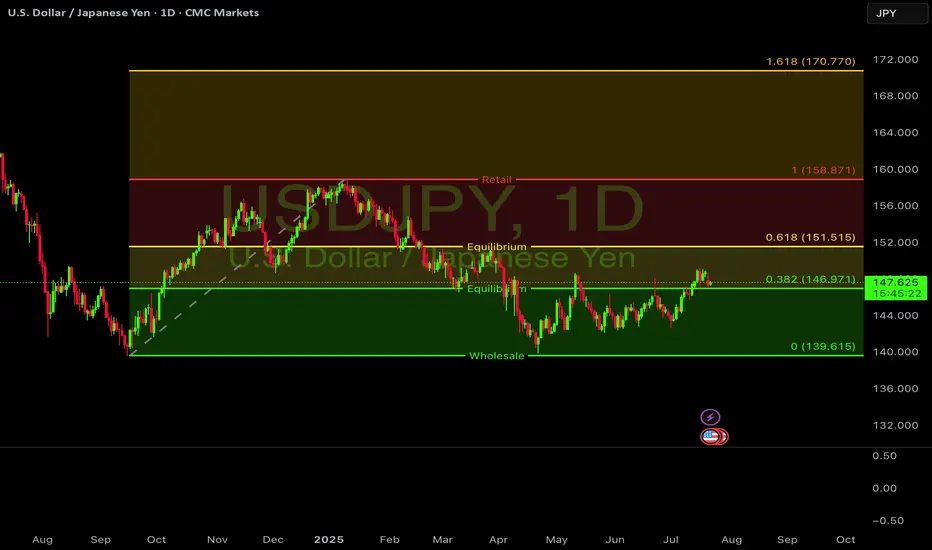
$USDJPY looking primed for another leg up.FX:USDJPY looking primed for another leg up.
The weekly chart shows a textbook Stage 2 uptrend, holding strong above the 200 EMA. After a healthy pullback, the price is now testing a key pivot level around 147.60, which aligns with a major support zone.
On the 4-hour chart, the Stochastic oscillator is approaching oversold territory, suggesting the recent selling pressure may be exhausted. A bounce from this support could be the catalyst for a move back to the 155-160 resistance area.
#USDJPY #Forex #FX #Trading #Bullish
USDJPY Will Fall! Sell!
Take a look at our analysis for USDJPY.
Time Frame: 2h
Current Trend: Bearish
Sentiment: Overbought (based on 7-period RSI)
Forecast: Bearish
The price is testing a key resistance 147.628.
Taking into consideration the current market trend & overbought RSI, chances will be high to see a bearish movement to the downside at least to 146.784 level.
P.S
Overbought describes a period of time where there has been a significant and consistent upward move in price over a period of time without much pullback.
Disclosure: I am part of Trade Nation's Influencer program and receive a monthly fee for using their TradingView charts in my analysis.
Like and subscribe and comment my ideas if you enjoy them!

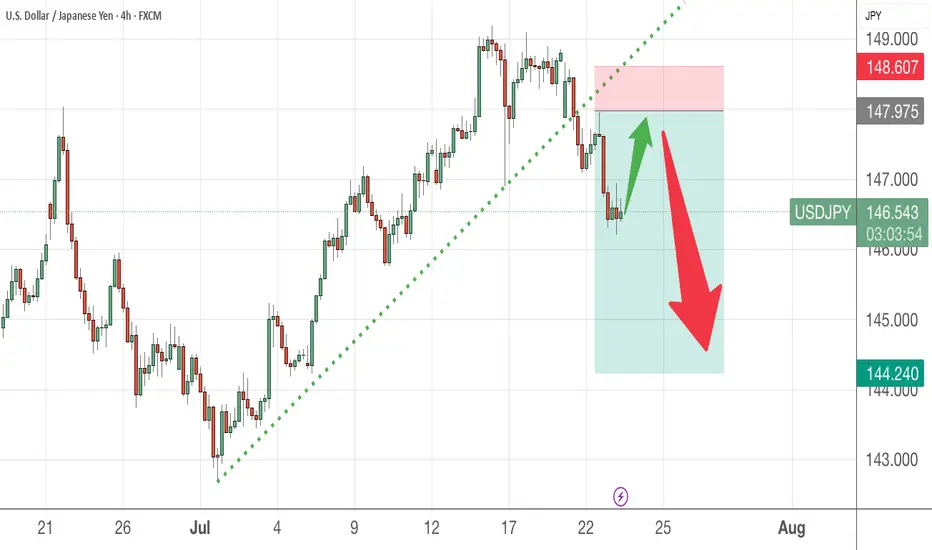
USD/JPY 4-Hour Forex Chart4-hour chart from FOREX.com displays the exchange rate between the U.S. Dollar (USD) and the Japanese Yen (JPY). The current rate is 147.446, with a slight increase of 0.072 (+0.05%). The chart shows recent price movements, including a notable drop within a highlighted support and resistance zone (light green and pink areas). Buy and sell prices are marked at 147.446 and 147.444, respectively, with additional price levels indicated on the right side ranging from 146.943 to 149.000. The chart includes candlestick patterns and is timestamped up to July 22, 2025.

Bearish Bias on USD/JPYBearish Bias on USD/JPY
Pair: USD/JPY
Bias: Bearish
Entry Type: Pending Sell Limit Order
Entry Zone: 147.54
Stop Loss: 148.10
Take Profit: 145.17
Technical Rationale:
Market Structure Shift (MSS):
The chart shows a clear break of structure (BoS) to the downside after a prolonged bullish move. The most recent lower low and lower high formation confirms a shift in market sentiment.
Supply Zone (Order Block):
Price is retracing back into a 2H supply zone (highlighted red), which is aligned with a bearish order block around 147.54–148.10. This zone represents institutional selling interest from a previous strong sell-off.
Liquidity Grab / Sweep:
Prior to the drop, there was an internal liquidity sweep above a local high, potentially indicating a buy-side liquidity grab. The retracement may now be engineered to tap into this supply zone to mitigate orders before a continuation downward.
Premium Pricing:
Using a FVG (Fair Value Gap) or Fibo level reference, this supply zone sits in the premium pricing area, ideal for institutional short positioning in SMC theory.
Confluence:
Bearish break of structure
Return to supply zone
Liquidity sweep before drop
Fair value gap alignment

Confirmed Breakout SetupThe 1-hour candle **closed cleanly and strongly** above the 147.050 resistance zone. No upper wick rejection, no weakness

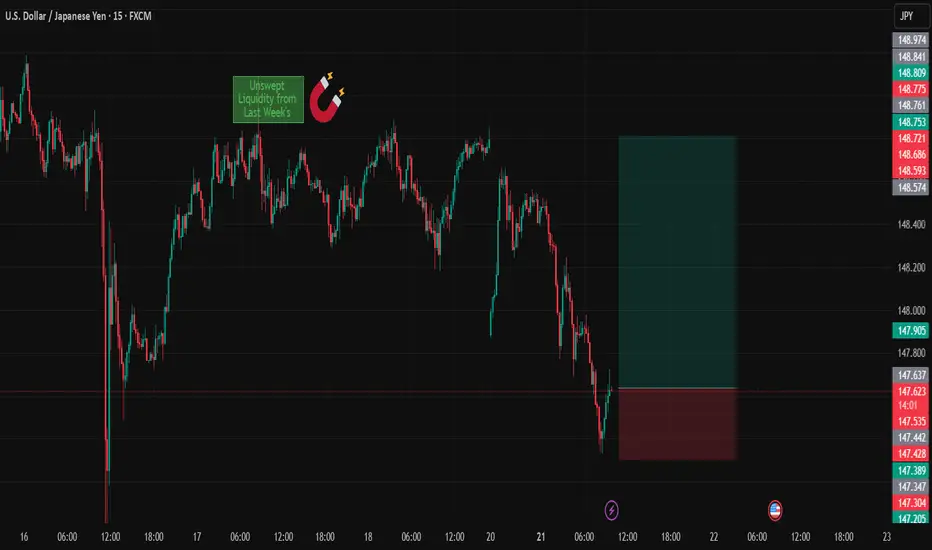
USDJPY
Date:
July 21,2025
Session:
New York Open
Pair:
USDJPY
Bias:
Long
1. Clean liquidity pool left unswept from last week's NYC Open (Thursday).
2. NY session typically retraces or extends from London reversal, giving directional momentum.
Entry:147.544
Stop Loss:147.250
Target:148.794
RR:4.11
[USDJPY] Trade ideaJust entered this long position on this forex pair for an upside move.
Trying to catch the continuation of the trend on reversal pattern.
Great Trade !
