ABG weekly trendline line holdsABG found support off both its weekly uptrend line and horizontal support at the R171.50 level.
if this level holds we can look to test the upper resistance trendline going forward
ABG trade ideas

Absa showing downside to R135.00 - SMC also appliedPATTERNS:
Absa is forming one of the two
Either an Reverse Inverse Cup and Handle .
Now price is broken below the handle, the chance is that it'll head to R135.60.
Or it's forming a head and shoulders where the Right Shoulder is now ready to form (upside) then downside to the target.
21>7 - Bearish
Price<200 Bearish
RSI<40 - Bearish
SMC:
We can see a Bearish Fair Value Gap has formed. This is where the 1st and 3rd candle does NOT overlap in price.
The market now will want to rebalance and move up into the gap to fill the orders before it comes down.
Hence, this is when the Right Shoulder will form.
If the price goes back up it'll give a short term BUY SMC to R185.00
If the price continues down then the target will be R135.60.
Regardless, the overall trend and bias is down in the medium term.

ABSA - At the bottom of the rangeABG has fallen quite hard and is currently trading at the bottom of the range of the blue parallel channel (175 ish..) Needs to reclaim 182 to get going again but a close below 172 could negate this move.

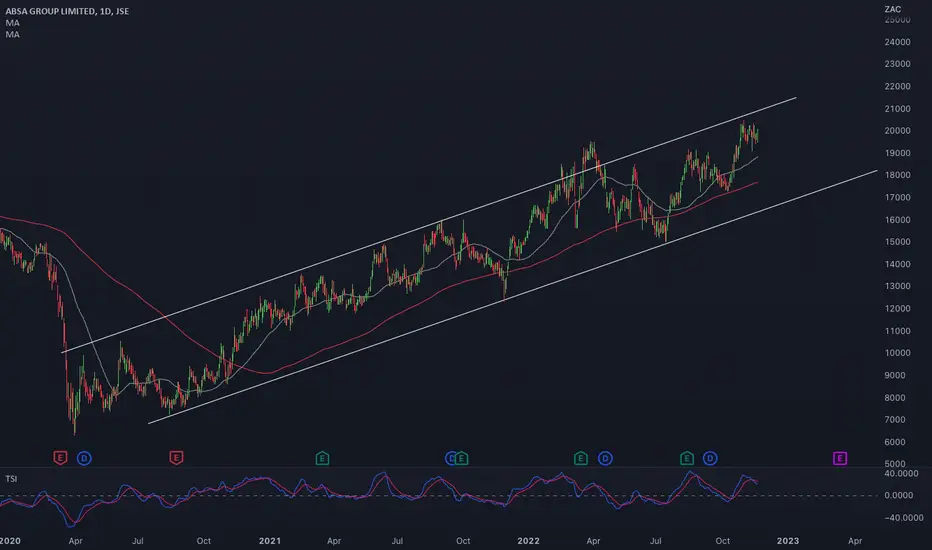
$JSEABG - ABSA: Potential Double TopABSA has had a strong run from the March 2020 low.
In November 2022, price tagged the all time high price at 21000 and has retraced since.
The rally from 6330 is well supported by the trendline but momentum shows a concerning pattern.
The MACD has made a lower high relative to the high of March 2018 giving bearish divergence.
This is not to say the share will go through a bear correction but it is a sign to be cautious.

ABSA - LongOur momentum strategy is showing all of the signs for a long position on JSE:ABG . We are aiming for a target at the 221 level and a stop loss at the 191 level with a 1:2 risk reward ratio

Ascending Triangle breakout and retestOn the 1st of Feb the price on JSE:ABG broke out of the ascending triangle it has been trading in. It has since retreated and gone back into the triangle. It seems as though it is currently retesting the levels at the apex of the triangle. If it breaks through the triangle again, I believe we will be in for a nice long position. The target would be around the 227 level.

And the trend continues. Beautiful Ascending triangle breakoutThe stock has been holding support on the 50 day EMA.
Continuation of the trade we low on this
The breakout provides a nice 3:1 R:R to a R232 target with R169 stop loss

ABG, unprend continuationNot the longest base but it seems like JSE:ABG has retested the recent breakout level & found support there. Not a bad place to add to the long position, if you have one.

ABSA - UptrendAbsa is trading in a well defined channel (upwards) and is further enhanced by by upward moving MA's. I would look to simply trade the range until we have a significant breakout of the channel - either way.
ABG To kick off the week, a chart from my research notes.
Absa Group (ABG, 20124c): Pending short/sell. The share trading between 2x and 2.5 it’s mean over 200 days.

ABG setupJSE:ABG went past the pivot point; the stock is currently within 5% of the pivot point. To chase or not to chase.

ABSA Absa bullish play broke out of the R193 resistance this move may push the stock higher to R220 and R250 respectively


ABSA Broken below Symmetrical Triangle BearishCHALLENGE TRADE IDEA:
TAKE PROFIT: R161.91
REASON: Bearish Symmetrical Triangle, Price has tested the resistance and has failed. With inflation coming out today, my cards are on higher inflation which will lead to higher interest rates and a fall in banks and other markets.
What are your thoughts?

Bearish Engulfing on ABSAA bearish engulfing candle formed on JSE:ABG on Friday. With this morning's price action, we have been triggered into a short position. The stochastic and MACD are also confirming this move.

ABSA - 🧐On the previous post we noted the hammer candle that had printed on the 200 day moving average
- Price has since broken below and is likely to keep with the short term trend down
- Next decent support is around R140-R144
-- MANAGE YOUR RISK - -
Disclaimer: All ideas are my opinion and should not be taken as financial advice.
If you would like me to have a look at any chart, direct message and i will post my thoughts, Happy Trading!


ABGUpdate: Absa Group ABG - 15752c. Negative price action as it looks to be building a topping structure with the incline support going back to the March 2020 lows at risk. Has seen a massive decline from my selling zone +19100c in late March.
Barclays continuing to sell as it possibly requires additional funds for it's acquisition of Kensington Mortgage Co.
A similar bearish setups seen on peers for example NED which is building a bear flag technical formation.
Negative (local, and possibly global) economic effects being seen to a certain extent in these share prices.

ABSA GroupJSE:ABG is at an area of value. It can go either way, if there are banks buyers, JSE:ABG might move up. Otherwise, if the sellers are strong they can push the price lower. No position at the moment, and JSE:STXFIN doesn't look healthy.

ABSA - Support off 200 dma ABSA printed a hammer off the 200 day moving average
As long as price holds above support, the chart continues to look constructive with an upside bias.
Attractive P/E Currently 7.6
-- MANAGE YOUR RISK - -
Disclaimer: All ideas are my opinion and should not be taken as financial advice.

ABG reversalABG made a reversal candle of support at R156 area. I am looking for a bounce to its 50dma.
Trade ideas are my own and not financial advice.

ABSAThe 156ish area has been providing support since January 2022; and it looks like we heading back there again.
But I will be cautious in buying that support this time for the simple reason that price failed to reclaim the previous YTD highs, and is forming a bearish Head & Shoulder pattern in the process. Should we lose that 156 neckline support, it may get ugly.

ABSA - ShortJSE:ABG is looking good for a short position. All 3 momentum indicators have crossed downwards.
