ABSA heading for R179 per shareAs the price is approaching the minor resistance, I am looking for price to reject and drop back to R163,46 for buying opportunities. it is possible for price to breakout on the first approach. if it does breakout the analysis is still valid based on retest.
ABG trade ideas

ABG - Support BounceWe may derive the following from the Weekly ABG chart:
1. Price has bounced right off the weekly support. See linked idea.
2. Price should in all probability continue to rise, however be cautious of sell levels. If you haven't bought, do not buy now.
3. Monitor price action and look out for clear opportunities.
4. As always - maintain your risk.
Note: The views provided herein do not constitute financial advice.

A Trade Idea On Absa (ABG)This morning at 11:30am, Statistics SA released our Second Quarter GDP figures, showing growth of 3.1% (QoQ) versus forecasts of 2.4% and a previous reading of -3.2%. As a proxy for GDP banking shares set up well for a bullish reversal. This afternoon I am looking at Absa as a short term buying opportunity.
Key Technical Drivers:
- Developing a double bottom
- RSI trending higher, attempting to break above the bullish 50 zone
- Money Flow Index forming a positive, upward trend
- Clearing shorter term upward trending moving averages
Trading Plan:
Buy ABG at current levels, R154.01 (or better)
Use a stop-loss of R149.70 to protect capital
Take profit at or near R161.50

Can we get a little rise on ABSA?We are expecting to have this double bottom push us high for that retest and also a QML


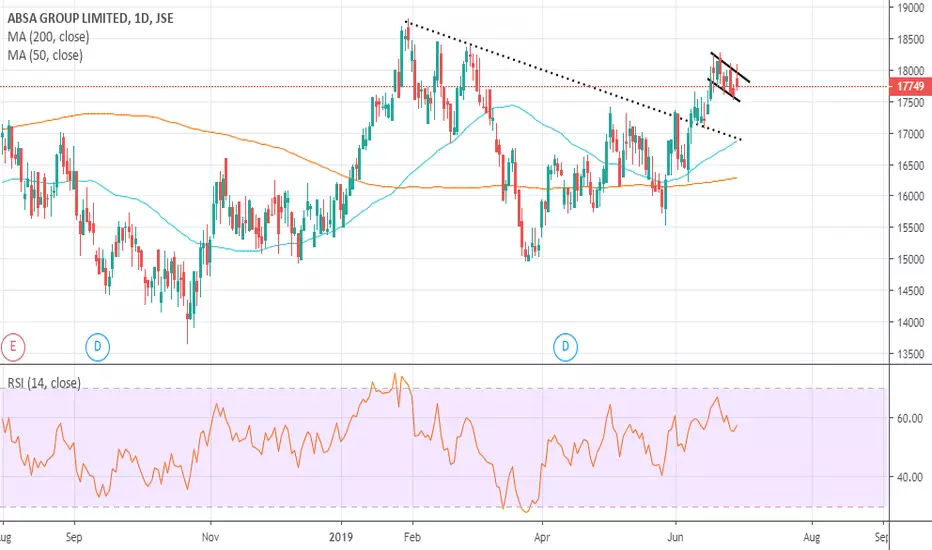
ABG - a high probability trade setup busy unfoldingA conflux of technical indicators supporting a bullish bias.
The blue line on the main chart is the lower two standard deviation range. Increasing probability for mean reversion.
Breaking its 8-day simple moving average. First signal in the last 21 days.
Breaking its 21-day simple moving average. First signal in the last 19 days.
MACD bullish crossover. First signal in the last 36 days.
Heikin-Ashi bullish trend.
Breaking up through its linear trend. First signal in the last 21 days.
Retracting from RSI oversold territory, which highlighted an overextended price action to the downside.
Stronger USDZAR might assist the price action.
Time to exit: +/- 4 September 2019

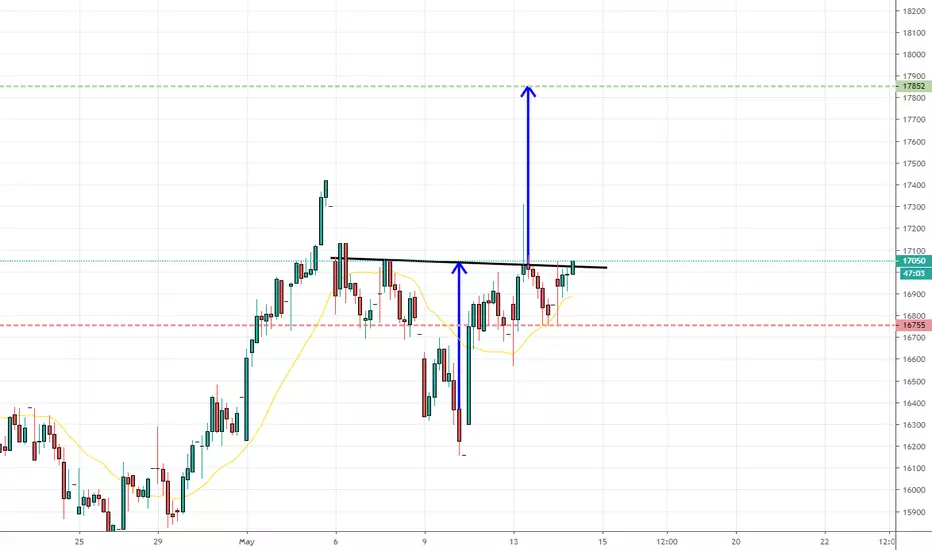
Update on ABSA long ideaThe first entry at the break with a tight stop for a great RR.
Target around the 18210 area.
Will be scouting the smaller time frames for more long entries.

ABSA @ SupportJSE:ABG seems to be bouncing off of a support level at the moment as well as having broken through a descending resistance. We could be looking at a long move if it confirms.

ABG - CrossroadsWe may derive the following from the Weekly ABG chart:
1. Price is at a major support level.
2. A bid is most likely to occur and buyers may step in.
3. However, a break of the trend is also possible. I would monitor price action and watch for shorting potential.
4. As always - maintain your risk.
Note: The views provided herein do not constitute financial advice.
Update idea

JSE:ABG Absa looks ready to go from hereAbsa seems to have completed a flat correction with a clear ABC structure.
A break above the declining trendline could open up a move towards 20000.
An entry will be confirmed by a small correction after the initial impulse (retest)

ABSA on its way upJSE:ABG has broken through a descending resistance and has confirmed the break with yesterday's action. If it breaks through the fractal from the 12th of July's candle, it could mean an upward move.


ABSA Gap Fill and SRLooks good here
Wanna see the Volume dry up here and this level must hold but i like this one for a long swing


Bull flag on the Absa Daily chartZAR is strengthening, global stocks are high, tracking the positivity out of the Trump-Xi meeting at the G20; and we have bullish bull flag on the Absa Daily chart.
I’m still monitoring for levels, but I’m anticipating a break to the upside.

ABG out of sideways consolidationJSE:ABG has broken out of the sideways consolidation that it has been trading in. It has also broken through a fractal and is looking good for a long position.


ABSA ShortJSE:ABG has broken out of the symmetrical triangle pattern that had formed.
Today it seems to be retracing a bit and you might find that it will bounce off the resistance before continuing downwards.
Depending on your risk appetite, you can enter a short right away or wait for a retracement and bounce before entering.


Let it fall then get inABSA is set to fall a little bit, before it shoots up, so in the mean time we can wait for it to get to the buy zone then we jump in

JSE:ABG Absa Bank Ready for a Markup?Absa Bank is looking strong even as the Rand and the JSE are looking weaker. Absa's pears in the Banking Sector are also looking weaker. Absa's relative strength to the Banking Sector is improving. There are a number of indications that Absa is going to buck the trend. The location in the accumulation structure is at a good place to go long. We have seen an accumulation trading range (TR) with a Selling Climax (SC), Automatic Rally (AR), Secondary Test (ST), A Spring, Last Point of Support (LPS) and now a Backup (BU) to the TR. An upward channel has formed and it is now testing the lower trend line which is also the 50 MA and the Yearly Pivot Point. Further, there is a negative divergence with the volume RSI which is a good continuation signal. Volume is increasing on up moves and decreasing on down moves. We need to watch how it reacts this week to the lower trend line and top of the TR to confirm if we are going to get a markup.
