AMS .... Time to turn the corner?AMS seems to be at a cross roads .... wondering if it will turn up or follow on down until Sept.
AMS trade ideas

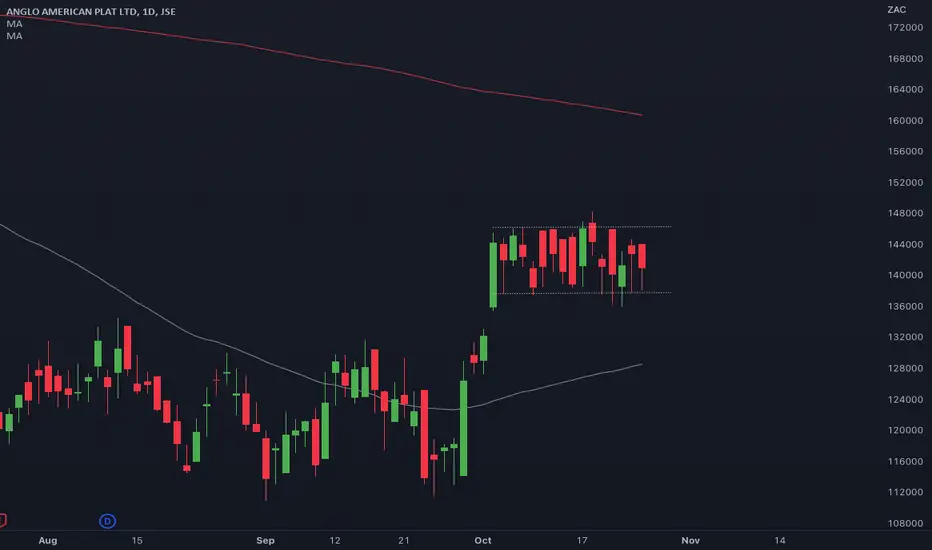
Anglo Plat showing strong upside with inv C7&H to R1,500Inverse C&H has formed on AMS over the last month and a bit.
This has been the consolidation range as the downtrend seems to be coming to an end.
We are seeing signs that the price is nearly ready to break up and out of the pattern.
7>21
Price<200 - But the price need to go back up as it acts as an elastic.
RSI >50
Target R1,500
SMC
Sell Side LIquidity Order block has formed below the handle of the cup
Smart Money buys into positions (and sweeps liquidity) from traders who are long (get stopped) and for short traders who enter into their trades.
Bullish Bias

Angloplatinum (AMS) Long and Short PlayAngloAmerican Platinum is flashing a bearish sign early into the weekly cycle, it could be leading platinum metal into a bearish trend. On the daily chart time frame we would have wanted price to not break the low on 22 November but as of today (14 December) price has made a lower low.
The probable route now would be price action guided by the megaphone depicted by the blue lines, this becomes a high probability move if 22 November was not a daily cycle low (NB previous daily cycles out of a weekly cycle were of length 57 days as is 22 November low), then we can expect a daily cycle low of close to 90 days. What to do amid uncertainty:
1. Reaction of price on the lower blue trendline can allow a long position with target orange line, by then RSI 14 should be oversold.
2. Reaction of price action at orange line, if it breaks, hold long & watch for R1735 reaction, rejected, close long & go short.
There is some good money to be made by trading price action this way though it requires one to be of nimble fingers.

Anglo American PLatinum setting for upside potential to R1,644Potential Cup and Handle is forming on the daily.
We are seeing higher lows form and the supply side is dwindling.
Once we get a break above the brim level, it'll be all systems go.
7>21
Price <200 - Bearish
RSI>50 -bullish
Target R1,644.61
SMC:
Sell Side Liquidity order block has formed below the formation. Each time the price touches, it runs up. That's because Smart Money comes in sweeps the selling from (Shorters) and long traders who gets stopped. They buy into the orders, which push the price up.
This gives bullish bias.

$JSEAMS - Anglo American Platinum: Searching For A Bottom Anglo Platinum is down significantly from its all time high of R2675,38 and the 14% rally of yesterday has created some market excitement.
Taking a look at the bug picture, the stock seems to be making a large (ABC) zigzag bear from the all time high.
Wave (A) was a very large and extended impulse and wave (C) is also unfolding as an impulse.
Wave (C) looks to have completed wave 1 to 3 and from R932,03 the bounce is for wave 4.
Wave 4 can push higher but for this outlook to remain valid, wave 4 must terminate below R1337,70.
I forecast one more push lower to complete wave 5 as my preferred count.

AMS - ObservationAMS has formed a diamond pattern which has the possibility of breaking up (reversal pattern) or down (continuation pattern).
The target zone just below is still open but i will be watching the shorter timeframes for clues of which way the break is likely to occur.
Platinum price is also at a key level to watch 🧐

AMS: some upside potential over time?A price action above 102900 supports a bullish trend direction.
Increase long exposure for a break above 108800.
Target price at 117000.
Stop-loss at 95200.
Negate the long posiiton for a break below 102900.
Based on implied volatility, it will take about 180 days to reach the profit target (which I doubt), but let us see if this might be true.
Implied volatility is a measure of the expected magnitude of price fluctuations for a particular share over a certain period. It can be used with an options pricing model to estimate the probability of a share reaching a certain price level by a certain date based on market conditions and assumptions about the share's volatility. However, it's important to note that the accuracy of the model depends on the accuracy of the assumptions made and that share price movements are unpredictable.

Anglo American PlatinumHere is medium-long term shorting set up for those who are patient enough. Its Head & Shoulder chart pattern in play!
I'm calling it 500!

AMS - Head & Shoulders ?Anglo American Plat has been one time framing down on the weekly.
Target zone below still valid and we have what looks to be a head and shoulders as well which could take it back to covid low levels.
NB: Relief rallies can and do happen.

Anglo American Platinum - Overdone?AMS has sold off quite heavily breaking a few support levels to the downside - (1370), (1124) and finally (1050). Not even the blue TL held up. Stock might be overdone short term and could be worth a bounce at these levels for a medium term hold. Look to trade in the 1050 - 1370 range.
Unfortunately seems to have free air below, so stop loss is a tough one. Discretion required.

AMSJSE:AMS fell to the potential support level, as shown in a previously shared idea. NYMEX:PL1! is weak and PGM miners are receiving hands from that weakness.
Will there be buyers here?

Pair trade: Buying AMS vs Selling SSWA bullish trend is applicable.
The ideal entry price is as close to 28.3365 as possible.
Increase exposure for a break above 30.1990.
Target price is set at 33.8980.
Stop-loss price is set at 27.4245.
Time exit: 2 May 2023.

#AMS - time to accumulate again?Since the highs in March 2022, Angloplat has corrected almost 50%. I am starting to become interested in this chart on a medium term basis for the following reasons:
(1) Supported off 61.8% fib from Mar 22 and Mar 20 Highs and lows
(2) Rising channel support
(3) Has tended to consolidate under the 200WMA before reversing on a weekly time frame
(4) 200wma still trending upwards
(5) supported off September 21 horizontal lows
Remember this is a weekly chart so it could take some time to play out with the possibility of weekly consolidation in this zone, but ultimately I would bet on my chances of this resolving higher in due course.

Bearish and Cautious on Platinum Stocks.Bearish and Cautious on Platinum Stocks.
There seems to be a Head and Shoulders Pattern forming.
Trade Wisely. Regards.
Graham.

AMS NYMEX:PL1! miners seem to be under pressure, JSE:AMS bearing the brunt thereof. A close below R1360 opens a potential move to near R1150.

AMS, bullish?We've noted several PGMs turning bullish in the past few weeks, and we have an JSE:AMS position. At the moment JSE:AMS seem to be retesting the (rising) 200MA, if it find support there, the stock may continue to rise, especially if the sector is turning bullish. Other notable players are JSE:IMP & JSE:SSW (position)

Short triggered on AMSA short has been triggered on JSE:AMS . We are looking at a target at the strong support level of around the R1250 level.

Amplats to break above 200MA up to R1,917Inverse H and S on Amplats
The break out of the neckline was strong and the MAs look good
7>21- Bullish.
Price is testing 200MA but looks like momentum will help overcome it.
Target R1,917.58

AmplatsImpressive run on Amplats during past few weeks. We can target 1800 in the short term; but first, buyers have to push through the 200dma.

JSEAMS - False breakout (Short)After the attempted breakout i believe there will be longs trapped here after the hawkish FED last night. Platinum is also up against overhead resistance.
Expecting a down move towards the gap below and probably could even test the consolidation base .
A daily close above R1530 negates the bearish view.

Anglo American PlatinumAmplats has been going sideways for a little while now, trading in a clearly defined consolidation range. Ideally we would like to see a breakout of this consolidation, with a move towards its 200DMA, around R1607,00. Of course, we never pre-empt any market, we always wait for the price to confirm a breakout, either way.
AmplatsTrend is down, a bearish pattern (bear flag) is currently breaking; that's all the reasons needed to 'short' Amplats here for a potential move to 900.

Market Neutral Idea: Long AMS, Short IMPOver the short term, and on a technical basis, Anglo American Platinum ( JSE:AMS ) appears to be trading near a 'oversold' range vs Impala Platinum ( JSE:IMP ). On this basis, from a market neutral perspective, I consider a long (buy) position in AMS vs a short (sell) position in IMP.
The two shares have a high historical correlation however the recent trend ( JSE:AMS underperforming JSE:IMP ) has seen this correlation develop a discrepancy, opening up an opportunity to potentially profit as prices revert to it's mean.
A successful pair trade can be realized 1 of 3 ways:
The long position rises while the short position falls
The long position rises faster than the short position rises
The short position falls faster than the long position falls.
Pre-market view of entry levels (subject to change based on subsequent intraday price action).
Last close of ratio price: 7.16
Preferred entry range: 7.05 - 7.18
Stop-loss: 6.92
Target: 7.75
For more research, including trade ideas, get in touch today.
