ARI looking Near Vertically bullish making new highsThe stock seems to be in a nearly vertical bull market. A trade that I picked up a while ago and have been adding to it. Last week the stock made a new all time high, taking out the prior all time high of 30699c it set back in July of 2008. The share has now made a 100% recovery from that high. The new high is now 30725c. I’ve decided to remove my target on this trade and I will now only exit on stop across all positions. I think the share will run even further and make even higher highs.
checkout the weekly game plan here: villagetrader.co.za
ARI trade ideas

A nice Ascending triangle patternA nice ascending triangle pattern if we break through the 26000c level. A chance to add into the position

Bull Flag trade triggering. Taking out the highsAfrican Rainbow triggers long trade. taking out the highs

Bullish flag on African Rainbow MineralsAfrican Rainbow, has been a trade I like for a while now. We have a nice full flag on the share. The flag pole is quite long as well. Protecting the price 28960c

ARI Bull Flag.Potential bull flag in the making. If we see a rally after US election this can be a good setup to keep an eye on.


Falling wedge on African Rainbow MineralsJSE:ARI
We have a nice falling wedge on African Rainbow Minerals


Weekly game plan 19 July 2020 - ARIDepending on the method used to indicate resistance (de Mark or Williams, or real body closes), this is either very close to or already has given a buy trigger.

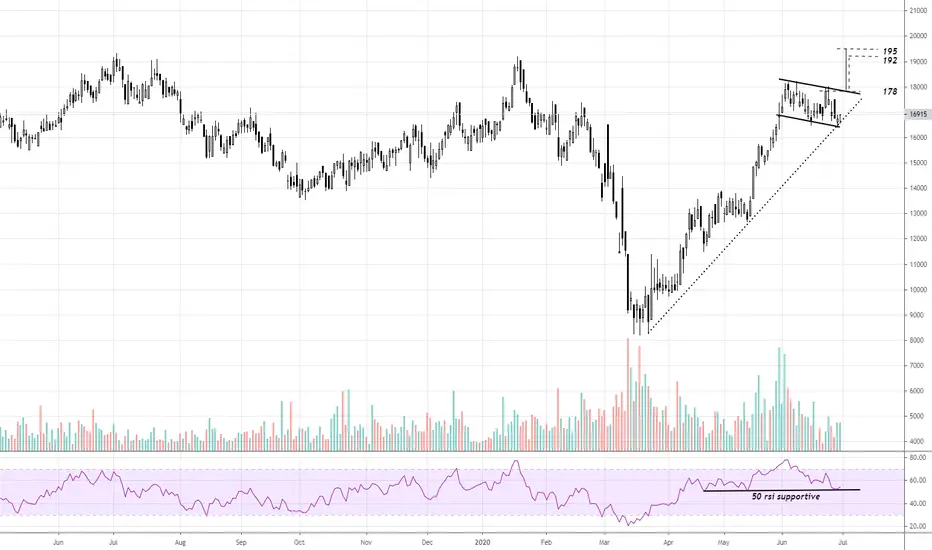
$JSEARI African Rainbow Minerals looking rock solidNice bullish flag consolidation over the last month which has bumped into the trendline support which formed off the pandemic lows. RSI holding at the 50 level which is often supportive of a bullish trend . A break out of the top of the channel at R178 could see African Rainbow Minerals move to the flag target of R192- R195
ARIThis chart forms part of a larger research note. None of the information posted here (TV) should be considered financial advice.
ARI has started to retreat from the major supply zone of 18000c-19200c. The recent consolidation top has been broken with the price below the 8-day EMA. Also noticeable is the price (17232c) currently extended well above the 50-day EMA (14983c). I’m expecting a moving back to the pivot (P) 15642c, followed by 15000c. Caution, time for a further pullback and consolidation on this name.

African Rainbow Minerals (ARI) - Short Term Tactical ViewAfrican Rainbow Minerals (ARI)
On an intrday/ultra short term basis the most recent 3-day lows 12520-12635 appear an attractive level for traders looking for a short term 240c-280c gain. Price remains above the rising 21-day exponential moving average. We see a pullback at the open (close has been right into the 0.618% FIB).

ARIARI - Gap closed, on incline support, which is just above the 200-day. Has retreated from 192 to 166 in six trading sessions. Potential rebound zone. toward 17300c. SL: 16350c

Pair: African Rainbow Minerals vs Sibanye GoldPair Trading Opportunity | Long ARI, Short SGL | On Friday 22 November we saw the daily candle close with a bullish engulfing formation. At the last close, the 200-day moving average is 70% above the current price of the ratio chart, signaling an extension well beyond the standard deviation. In addition, the 6 month performance of the two shares is startling, with ARI slipping by 1.57% while SGL saw it’s value increase by 134%. The current ratio level of 5.65 represents an opportunity to go long the shares of ARI while simultaneously shorting the shares of SGL. Use a stop-loss of 4.90 to protect capital with a target price of 7.20.


ARI - H&S, Bear FlagEquity CFD | African Rainbow Minerals | ARI, 14769c
- Price developing bear flag at neckline of head and shoulder formation.
- Re-test and failure of neckline is the preferred short trade level (aggressive)
- Confirmation/break of bear flag (conservative)

ARI - daily Head/shoulders breakdown confirmingA close below the R149.00 will confirm a HS breakdown on ARI.
RR 1:1

ARI bearish HS breakdownARI has closed and broken down below the R152.00 level targets around R137.00
RR: 1.6

$JSEARI - Trending upwards nicely#ARI continues to trend upwards. A good area to go long would be around 173-175. A good stop loss would be a break below TL support.


H&SWe are expecting this pair to fall because of the H&S that has just built and we are not at the right shoulder

