$BHP watching for confirmation from RSI (flattened) - done
MA 50 and 20 - looks like we have the 20 and had the 50
stoch - turn around
MACD - blue cross up
BHG trade ideas


BHP Stock - London Market Open - BUY!BHP News and performance are looking good!
The Auto Fib Retracement is being respected and the max resistance had been passed. Definitely a BUY:
Entry Price: 1750.00
SL: 1720.00
TP1: 1770.00
TP2: 1790.00
Until signs of reverse!

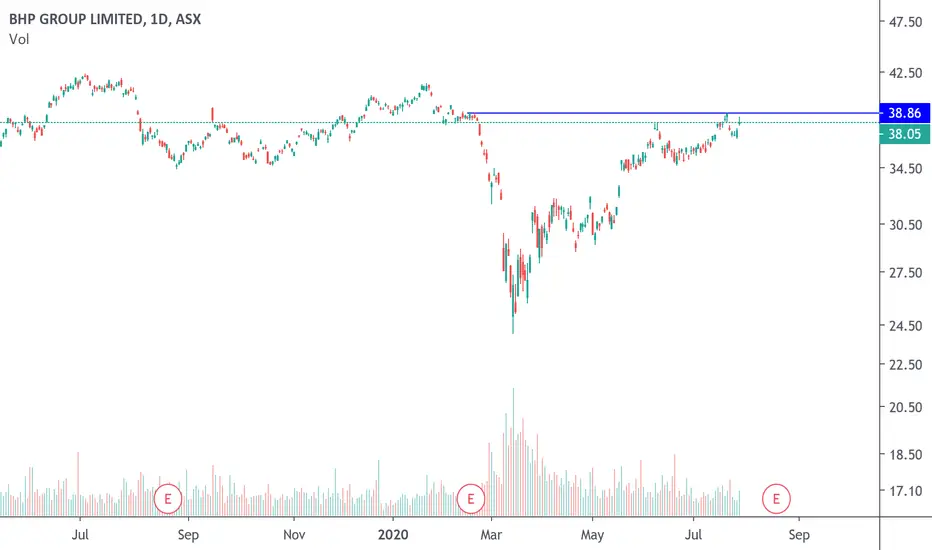
BHP Group $BHP "Cup"It is forming a cup and $38.04 is the confirmation for the pattern.
12 months Consensus Price Target: $60
if you find my charts useful, please leave me "like" or "comment".
Please don't trade according to the ideas, rely on your own knowledge.
Thx

Holy Grail/ adx gapper/ 80-20 all signals triggeredThis is a triple confirmation on strategies from Streetsmarts...
1. Holy Grail is watching ADX it should be correcting only from uptrend > 30
2. Gap below yesterday's low then reversal recovery in morning at 35.10
3. 80-20 is yesterdays range opened in upper third, and closed in lower third; today's gap down then recovery of yesterdays low, buy > 1st hour bar > 35.25...hold until close or next day
4. technically there's an ABC style correction in a strong uptrend which tips probability that could recover multi-days even if miss low a bit ( call options could be considered if GAPS down to obvious target for C leg...as a re-entry method)
5. 6 days ago was a low, that is also beat > 35.35 showing another reason shorts may 'cover' or take profit...

BHP Billiton Ltd(BHP) Price chart analysisBHP Billiton Ltd(BHP) had a slow start in today's session, with its opening trades below Friday's session but picked up momentum after breaching 45.20. It has crossed another critical point at 35.48 at the time of writing and could be heading towards its next target at 35.90. The critical support level is at 35.48, 35.20, 34.80.

BHP - Massive volume breakoutBHP - Massive volume breakout
Surged in Ion Ore prices has lifted prices in today's session with a huge price gap to the upside.
Target 1 - 44.85, target 2 - 45.32, target 3 - 45.90, target4 - 46.95.
Support at 43.85 and 43.10


stay buyerstay a buyer it is very likely that the price will go up to $ 32.22 if the candle breaks the price forcefully then it will go up to $ 34


BHP Key 200 WMA| Oversold RSI| Volume Climax Evening Traders,
Today’s analysis will focus on BHP, sellers are in complete control after breaking key technical levels. It has been rejected at a technical point that will dictate the overall trend in the coming weeks and months.
Points to consider,
- Strong bear break
- 200 WMA – Current resistance
- Local support respected - .618 Fibonacci in confluence
- RSI coming of oversold
- Stochastics in lower regions
- Volume climax evident
The trend is bearish for BHP, breaking key technical levels in the recent sell off. The 200 WMA is a vital level for the overall trend, current acting as resistance.
Local support is in confluence with the .618 Fibonacci, breaking this level will target the 2.618 Fibonacci Extension.
The RSI is currently extremely oversold; this is considered to be an oversold bounce if it recovers to neutral territory. Stochastics is in lower regions, can stay trading here for an extended period of time, however lots of stored momentum to the upside.
Volume climax is evident; this suggests that the temporary bottom may be in. If BHP puts in a lower high, it will increase the chances taking local support out.
Overall, in my opinion, BHP has a clear level, 200 WMA, a break will increase the bullish bias as the .618 will hold true. A rejection will increase the bearish outlook, thus the first target being the 2.618 Fibonacci Extension.
What are your thoughts?
Please leave a like and comment,
And remember,
“Trading mastery is a state of complete acceptance of probability, not a state of fight it.”
― Yvan Byeajee


BHP.ASX with a BEARISH TARGET AS SHOWN after the COMPLETED TOP.THIS ANALYSIS IS FOR EDUCATIONAL PURPOSES ONLY.
BEARISH TARGET AS SHOWN ON THE CHART AFTER THE COMPLETED TOP.


BHP Breaking downThis is an intuitive hit that just popped into my head today. I don't know the stock, but options are really good. Symmetry support at $51.17
My pendulum reading suggests it's going to breakdown from these lows it's been trying to hold. It's possible they are going to purchase another company or something, and the news creates the drop. Idk.
I'm looking fro $45 in the next month, and maybe down to $41.50

BHP ASX - LongLooking at the levels , if we break the red we are looking for T1.
Overall trend is still bullish.

BHP LONGI have been watching BHP for a while
BHP has been on a slow upward trend. BHP is involved in a new technology project and I think the stock during the first three months of 2020.


