JSE:BID Bid Corp Advance Set to ContinueBid Corp has started an upward trend. After a small re-accumulation and some volume, the trend is set to continue. Negative divergence on the volume RSI also points toward a continuation.
BID trade ideas


BID LongAfter releasing goo results Bid corp is trending up,prudent to await some sort of pull back to the 50 EMA before entering for another leg up.


BID Bullish HaramiJSE:BID ha formed a bullish harami and is looking good for an upward move if confirmed by todays price action.

$JSE-BIDJSE:BID
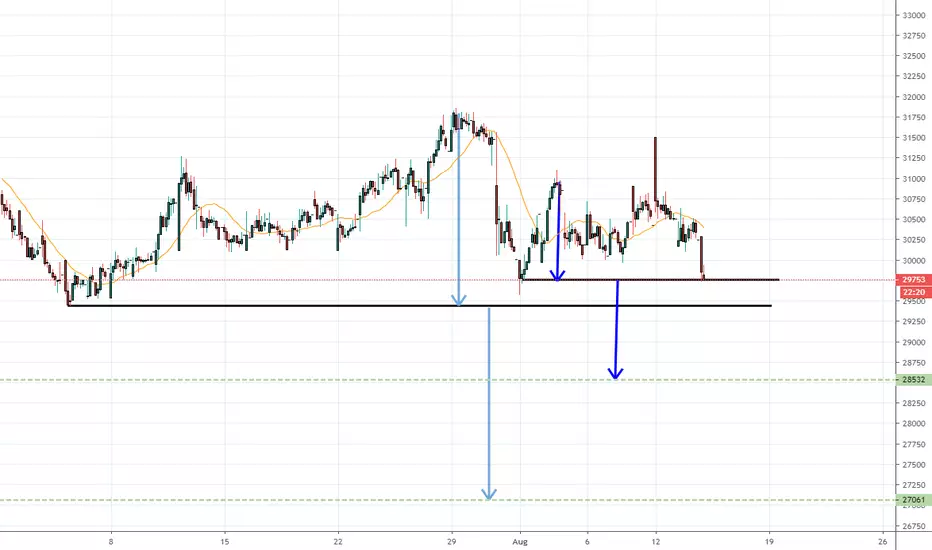
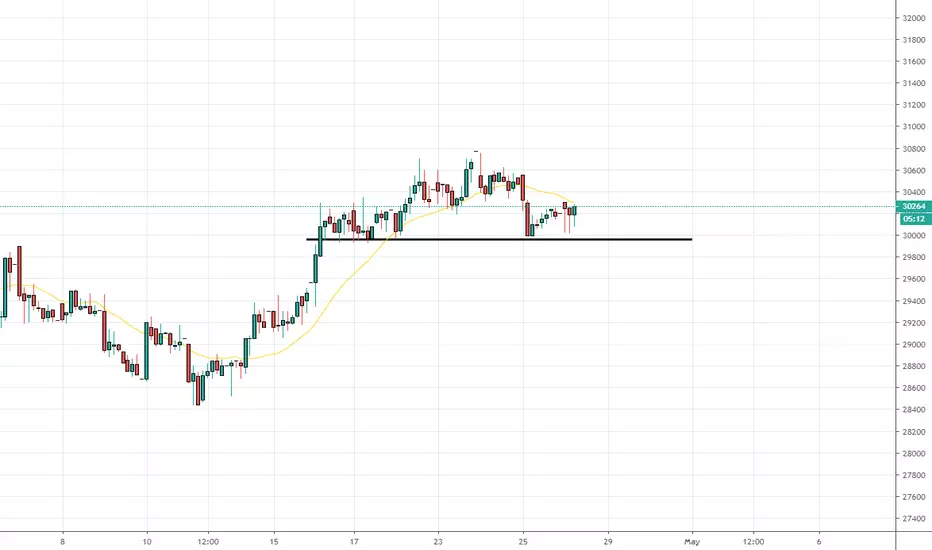
Broke trend line from December yesterday and doing back test today.
More aggressive traders can short on the back test, for the others wait for 29500 or there about to break.
Target is around low from December at 26000


Bearish engulfing candle on the BidCorp WeeklyI was unfortunate to be stopped out of this BID short trade last week after that spike to the R329 level.
Price has since come off from those levels to current levels below R310.
Looking at the broader weekly chart, last week’s candle is a bearish engulfing one, which suggest to me that more down might be coming in the coming weeks.
R290 or below remains on the cards.


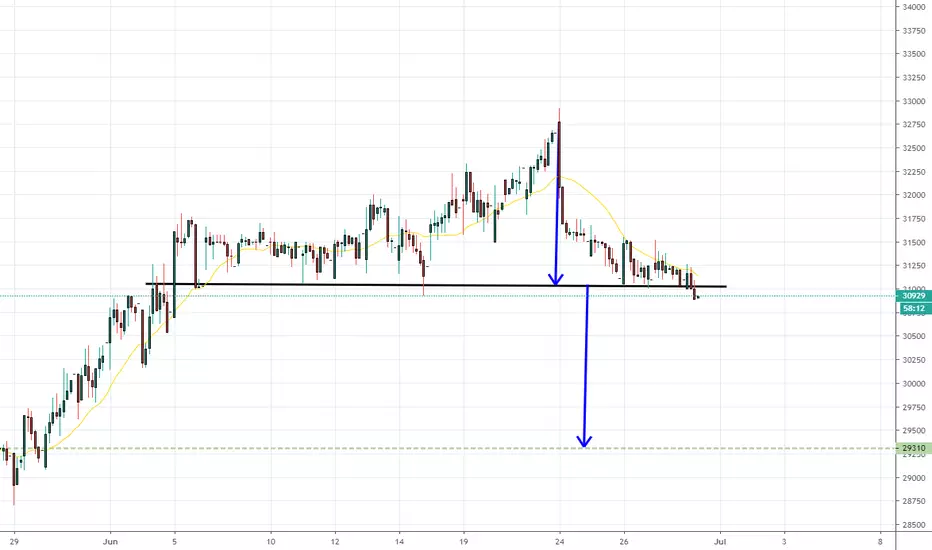
BidCorpQuite a strong move from the sub-R290 levels about 2 weeks ago to its current levels.
I’m going short at current levels (R315) for a move to below R300.
A breach of the resistant area around R320.70 will be my signal to exit; so my SL is set around R323/R325.


Monitoring closely - Will exit long on hourly close below R299Monitoring closely - Will exit long on hourly close below R299

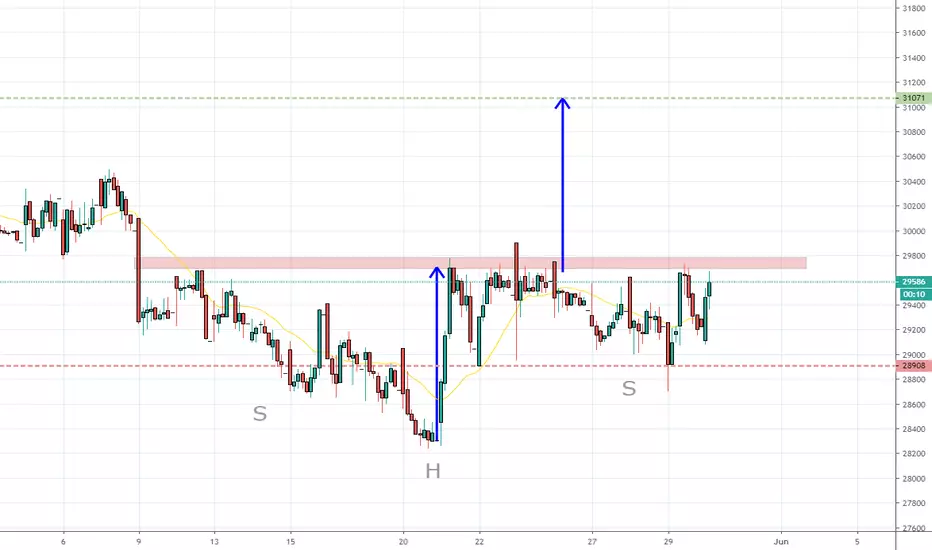
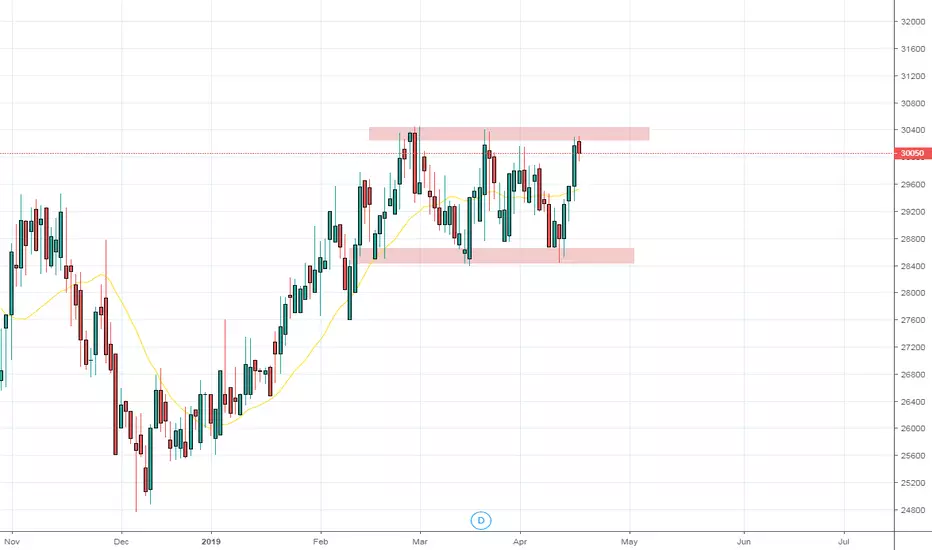
BID Corporation at ResistanceJSE:BID has been trading in a channel for a while and is at the strong resistance at the top of the channel. I am anticipating a downward move back to the bottom of the channel as it seems to have struggled at the resistance level before.
If the downward move doesn't happen and it breaks through the top of the channel, I will consider a long position.


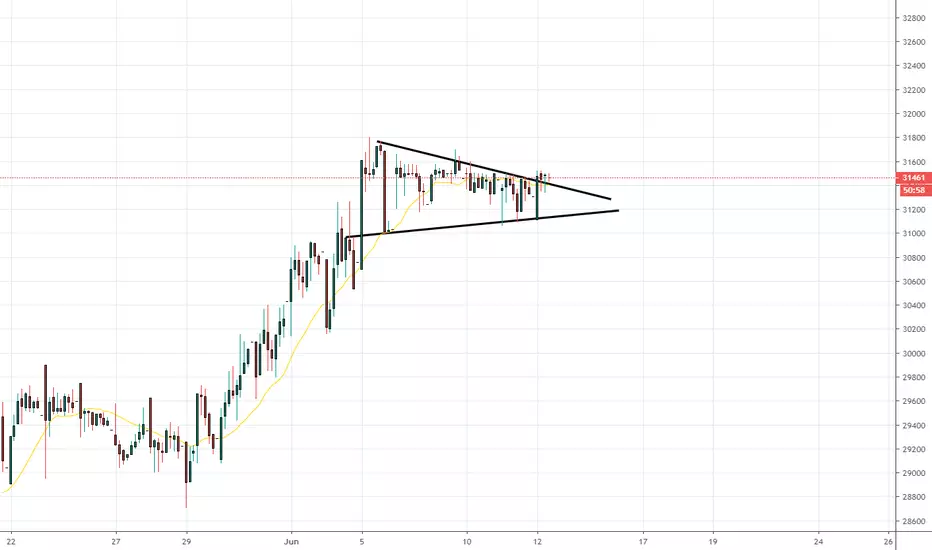
THE BIDVEST GROUP LIMITED (BID) 2-HOUR TIMEFRAME NEUTRALThe price on this chart seems to be making a series of lower highs and higher lows, signalling a symmetrical (isometric) triangle. Though this pattern is sometimes regarded as neutral, i believe prices might continue to go higher if and only if there is a breakout to the upside. There was a strong impulse to the upside and if the buyers remain persistent, we might see higher prices reflected by a break to the upside of the symmetrical triangle.
Verdict: Wait for break and follow the price.
