Bidvest - Bearish engulfingJSE:BVT has formed a bearish engulfing candle pattern and is looking good for a short if it breaks the fractal level.
Since I alerted a short a week or two ago on BVT it has gone up but is still looking good for a short which is being confirmed by the stochastic.
BVT trade ideas

Bidvest struggling at resistanceJSE:BVT is struggling at a strong resistance level and based on the stochastic's confirmation, we could be seeing a reversal. Wait for confirmation on today's price action before entering short.

BIDVEST LTDWe had a bearish continuation pattern, we thus anticipate a further drop to the demand zone

BVT Possible Trend reversalBVT Multiple Bounce on strong Resistance
possible reversal market weakness a factor
for existing Trend
JSE:BVT Bidvest Supply IncreaseBidvest has been drifting lower and testing support at 7500 with what looks like a downsloping distribution. Supply has stepped in with some volume. Negative divergence looks like the support will be tested again.

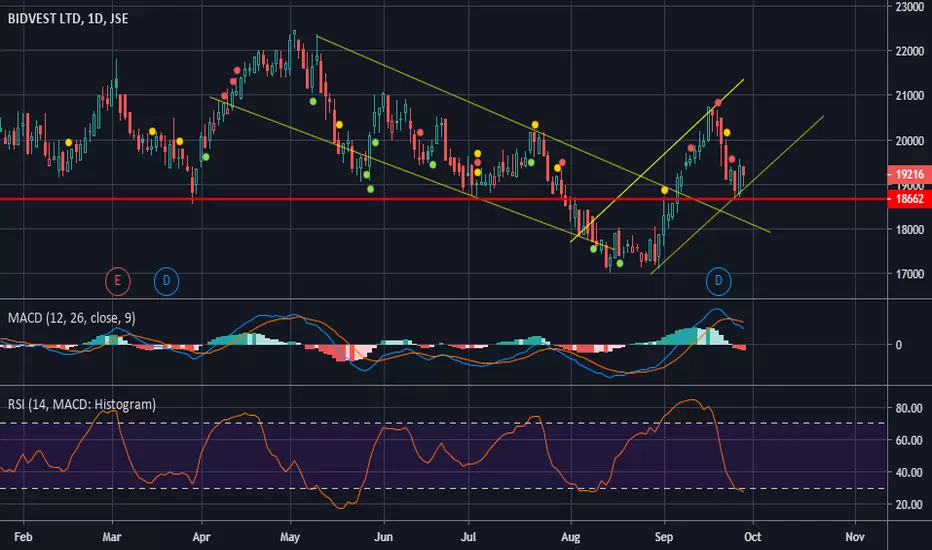
BidvestThe share has rallied strongly from the double bottom breakout at 18000c however is now trading in a consolidation range around it's flat 200-day moving average 19887c. Typically, we would see a share break above the MA before turning lower. This may very well be the case with BVT as a downside "gap" of 19293c may potentially be closed, acting as a short term target. The near term moving averages have lost upside momentum, suggesting a short term consolidation phase ahead.

BVT Short trade BVT weekly bounce on TR and Trend Analysis
expected bounce showing reversal of Trend
wait for confirmation opening tomorrow

Bidvest - Harami forming at resistanceJSE:BVT is currently forming a harami at a resistance and is looking like it will possibly be reversing. If tomorrow confirms, we will enter short.


Short BVTBVT is now facing resistance in the 200 EMA,the stochiastic is signalling overbought,wait for some sort of consolidation as a confirmation before shorting this equity in anticipation for a downleg.

$JSEBVT broken above channel resistance on hourlyShort term trade, but the hourly break above the channel resistance @ R179.50 should see a target close to R189.00. Entry between R179.50 - R181.50. Stop loss close below 176.00, let's see how this one goes.


BVT - Failed to break previous lowJSE:BVT has failed to break a previous low level from October 2018 and if today's candle confirms upwards, I will consider going long on Monday.


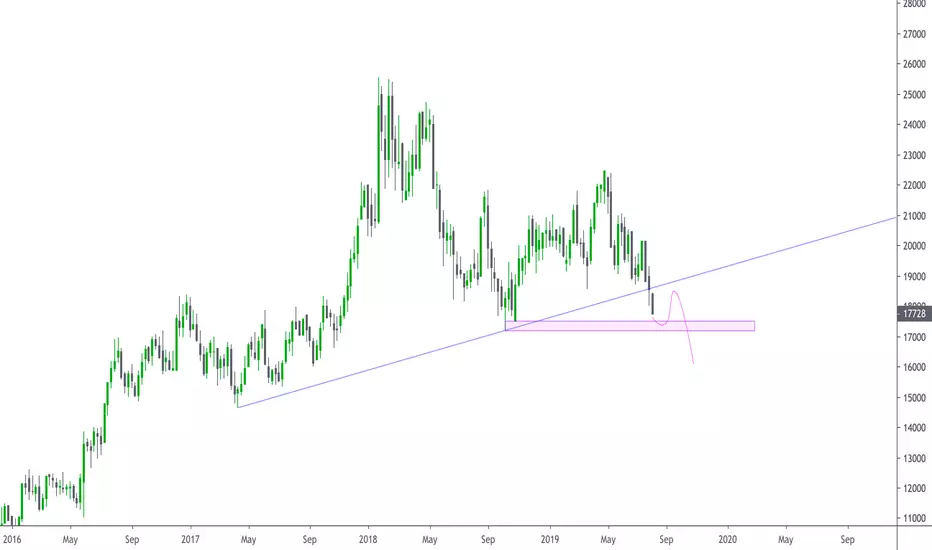
BVT - First Target ReachedWe may derive the following from the Weekly BVT chart:
1. Price has pretty much reached our first target (See linked idea).
2. Majority of profit can be taken.
3. A bid is most likely to occur at demand level (purple box).
4. Monitor price action and watch for further shorting potential.
5. As always - maintain your risk.
Note: The views provided herein do not constitute financial advice.
BVT - Descending Resistance breakJSE:BVT has opened on the other side of a descending resistance level which could signify an upward move if confirmed above today's high. There is a strong resistance level at 19000 so be mindful of that.

$JSEBVT Another weekly chart that's not looking too hot$JSEBVT Another weekly chart that's not looking too hot
BVT range breakout After trading in a range for quite some time, JSE:BVT has broken through the strong support at 19000.
A confirmation below the fractal level of 3rd of July could signal a nice downward move.


Looking for higher highs on BVTJSE:BVT seems to be heading for a break through the high from the 16th of July. If it breaks through this high we could be looking at a move up towards the resistance level at 21000.


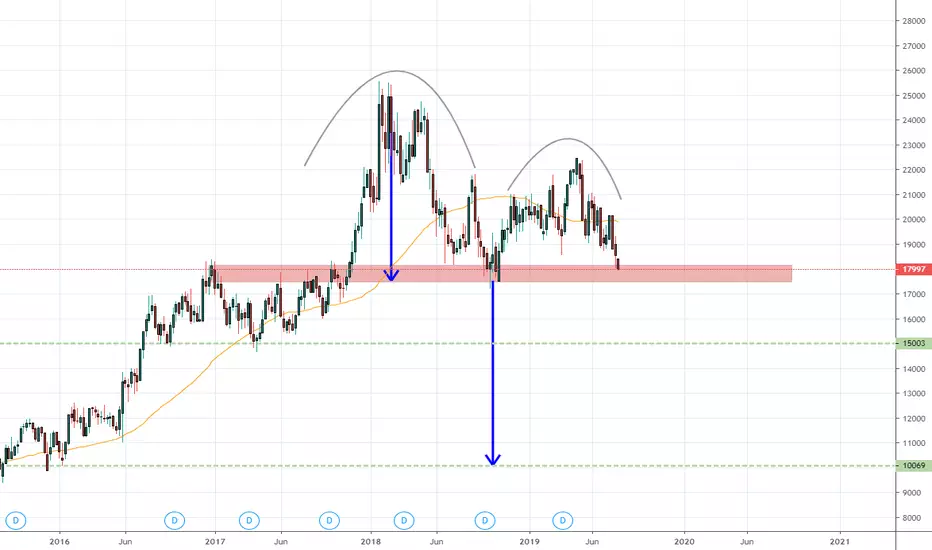
BVT - Bearish Head & ShouldersAfter a May Rally, BVT has drifted lower to form a weak looking left shoulder. On my daily chart it looks like the price has already broken the upward trend line support as well as the actual neckline. I will be looking to get short if we see a bounce towards R193.00. An extension of the recent high should see us attempt a target near R180.00.
From a momentum perspective, both the stochastic RSI and the RSI are looking weak which already implies, downside bias.
