CLS (W)For long term traders/investors, the share's proximity to it's 200-week simple moving average is a factor to note: (1) While the price has made higher highs over a 4-year period (vs it's 200w), the DISTANCE vs the 200w has showed negative divergence by making lower highs. This is often a precursor to a breach of the 200w. (2) The distance vs the 200w is narrowing while a downside breach of long term support is possible which may eventually see the price price losing support at the 200w. If there was any stock that has shown absolute resilience over the long term, it's JSE:CLS ...however at a 33 price-to-earnings ratio and a price to book ratio of 15x, the technical factors and structure, combined with the valuation should be borne in mind.
CLS trade ideas

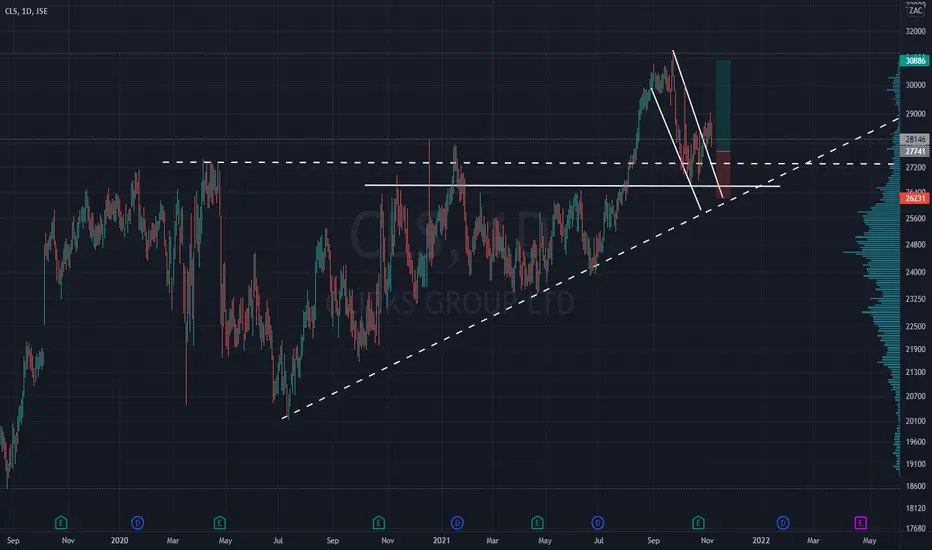
Clicks - Short enteredAll three momentum indicators have crossed downwards on JSE:CLS signaling a short position. Our target is around the 264 level.

CLS - Breakout of consolidationJSE:CLS has been trading in a sideways consolidation zone since early May. With the price action on the 16th of Aug we finally broke out of the sideways move. If it continues up, I think we could be looking at a nice long position.

CLS pending Symm Triangle breakoutCLS forming a tight symmetrical triangle pattern which should lead to a breakout soon

Buy CLS vs Sell SHP market neutral ideaPairs trade ide: Buy CLS vs Sell SHP (market neutral idea)
A price action that retracted from oversold territory supports the trade idea.
Furthermore, moving upwards from the lower range of the Bollinger Bands.
A price action below 1.2350 acts as a stop-loss.
Entry range: 1.2515 to 1.2855.
Profit target: 1.3530.

CLS: volatility squeeze?The lower panel indicates a potential volatility squeeze.
Expecting the break to be to the upside.
A price action above 27400 supports a bullish trend direction.
Crossing below this level will negate the positive stance.
Further trend support above 28100.
Consolidation range between 27900 and 28700. Crossing above 28700 might target 30100.
Crossing below 27900 might be the first sign

CLS supportCLS weekly hitting support at R270. If a bounce takes place my first target will be R285 and second target R295.
Trade ideas are my own and not financial advice.

CLS: ShortSlow stochastic bearish divergence
Stop loss: R298.29
Take profit: R285.03
Risk/Reward: 3.7
*No.1 Manage your Risk*

Pair trade: Selling CLS and Buying MRPA bearish trend direction is applicable below 1.5000.
Crossing above this level will negate the bearish trend direction.
Downside price momentum supports the bearish trend direction.
M-top pattern might result in further downside potential.
Might encounter support around the 200-day.

CLS - Triangle breakout with downward momentum.JSE:CLS has broken out the bottom of a symmetrical triangle patter. This breakout along with the signals from the EMA's, stochastic and MACD could mean we could see a nice downward move for a short position.

CLS - LongJSE:CLS is trading in an upward channel and has recently bounced off the bottom. Based on momentum indicators, it looks like it could be gearing up for a nice upward move towards the top of the channel.

AG Capital -Storm trading Morning Call 25 January 2022We give a quick recap of markets overnight and the previous day and insights into the day ahead with a few trade ideas on the day. Ideas are strictly NOT INVESTMENT ADVICE.

Clicks: Advance Following Character ChangeFollowing the recent candle character change (comment published and attached), CLS started find a decent bid and hit the 30793 upside level previously marked. That level was hit yesterday and today we saw another test with the level being rejected again.
For more insights and real-time ideas, get in touch today.

Clicks - Candle Structure: Character Change?Relative to the period 27-Sept to 18-Nov, CLS may be undergoing a "character change" - see shaded areas on daily chart. Monitoring lines A_B as a clearance zone.
*This is not a trading/investment recommendation*.

CLS - breakout level holdingCLS supporting the 266-273 breakout level, looking for this bullish action to continue
reward to risk 2:1
*Disclaimer* - ideas shared in the above is for educational purposes only and IS NOT trading or financial advice.
Clicks - That Piercing CandleThis morning, traded around 1570c HIGHER from publication 2 weeks ago. Looks like some resistance around these levels/slightly higher.
Original idea attached.

Room for a retracement on Clicks?JSE:CLS has been on a good run lately and has continued to form new all-time highs up until the previous high on the 22nd of September. At the same time, it has been consolidating sideways mostly since mid August. With today's downwards price action, we have broken out of the bottom of the consolidation area. If this downward momentum continues, I think we could see a retracement down towards the .5 or .618 Fibonacci levels before turning again upwards to potentially form new highs. Let's see what happens.

CLS likely to ourperform SHP?MACD bullish crossover suggests to be Buying CLS and to short-sell SHP.
Upside price momentum supports the bullish trend.
RSI leaves enough room for further upside price potential.
A weak indication that a trend might be developing.

Clicks GroupExtract from pre-market client note.
Printed a ‘piercing’ candle pattern where the price traded below the prior day low (27110c) then reclaimed and closed above that level (27149c). Tuesday’s low was also in line with the 61.8% Fibonacci retracement level and just above the prior breakout. On Wednesday, the share needs to hold the 27000c level to signal a potential short term bullish reversal. Above-average volume relative to prior 3 days.
Previous short around the 29700c level on 19 July. Got stopped out for -1.6%. The share subsequently traded higher before making a sharp decline to the current level.
For more insights and real-time trade ideas, get in touch today.


Pair trade: Buying CLS vs Selling SHPCLS likely to outperform SHP.
MACD confirmed a change in trend direction.
Upside price momentum supports the bullish trend (CLS is likely to outperform SHP).
RSI leaves enough room for further upside price potential.
Will be more relax of the pair is crossing above its 200-day.

CLS Idea Update: Closing For -1.6%Clicks Idea Update: The share has been quite strong over the last week, fluctuating between the current level and a low of around R292. It now trades 1.6% above my suggested entry (29580c). Stop-loss not tested however buyers have been resilient and on this basis, it may be best to cover and close the idea. A disappointing outcome.

Short Term Trade Setup: Sell ClicksVia my research, I've maintained two views on CLS:
1. The medium term ascending triangle is positive and could see higher levels being tested (possibility of 31300c/32200c), however
2. In recent days (the ultra short term), the price appears to be extended well above it's mean, with the technical indicators suggesting the price in overbought territory and, with the reward-to-risk starting to appear attractive for an ultra short term retracement.
Technically, the drivers for a short term pullback are as follows:
- Price extended outside of it's 200-period Linear Regression Channel
- Price overextended vs both 20-EMA and 50-EMA
- 7-RSI RSI at 94; 14-RSI at 85 - both in overbought territory
- Considering the Bollinger Band indicator (not visible), we note the price trading well above it's mean.
On this basis, we consider a sell/short, with the following levels:
Sell/Short at current levels 29533c, or higher
Stop-loss: 30315c
Target: 28200c
Links to recent short term and medium view are attached.
