Coronation Fund Managers Trade IdeaCoronation Fund Managers (CML) has seen it's RSI break up over the last few days, offering an early signal of strength and the potential for a short term recovery. Here, buy around current levels or better (4149c), using a stop-loss of 4030c and a take profit target of 4390c.
CML trade ideas

Coronation in a bearish consolidation?Coronation looks to be in a bearish consolidation on the daily.
A break of the R44 support area could expose its most recent lows around R39.
A bounce towards the upper channel cannot be ruled out though; but I’m favoring the bears here.

$JSECML - Targeting support around R39ish...Coronation looking like it wants to head lower short term.

Coronation no Funeral FlowerOnce one of the darlings listed on the JSE, Coronation has been on a slippery downward slope since December 2014. The reasons for this have been twofold. Firstly, valuations were extremely stretched (end of 2014), trading at a market capitalization (mkt cap) to Assets Under Management (AUM) percentage of close to 7%, while the average international ratio (for global Asset Managers) was trading at around 2%. Secondly, Coronation's growth prospects are questioned in a South African market, which has seen the entry of more competitors and the growth of a passive (ETF) market. At the current (mkt cap/AUM) ratio of 2.59%, Coronation is looking quite cheap compared to international counters:
XETR:ALV 4.6%
NYSE:BK 2.6%
NASDAQ:TROW 2.8%
Add into this mix a Forward PE (Source: Thomson Reuters) of 11 times and a Forward DY of 9%; then you get an opportunity in my view.
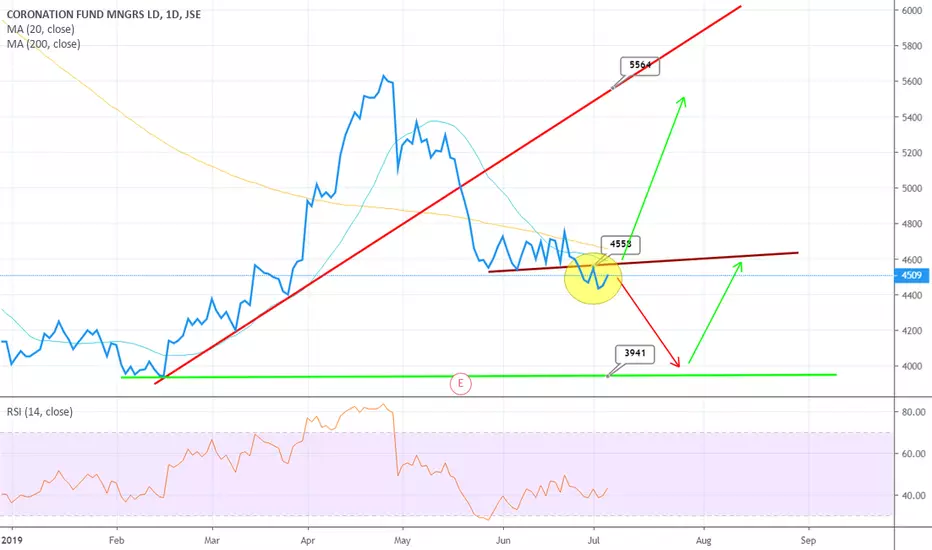
We can clearly see the Descending Triangle in the share price movement that developed since the April that could be very positive for CML, should we see a break and close above the resistance level at R44.25. A break a close above these levels could see the price seeking resistance at both the 50- and 200-day moving averages at R46, with next target then becoming R47.25.
The share price currently finds itself in extreme oversold according to its 14-day RSI. It has also massively underperformed the $JALSH over rolling 12 month period.
For short-term traders, I would recommend a stop-loss at R39.35.
Consensus target price (according to Thomson Reuters) for Coronation is R44.82 but only covered by one analyst (Avior Capital Markets).

CML - Weekly SupportWe may derive the following from the Weekly CML chart:
1. Price is extremely volatile at the moment.
2. A distinct weekly support is approaching.
3. Price i.m.o should catch a bid at the support level.
4. As always - maintain your risk.
Note: The views provided herein do not constitute financial advice.

CML - Broke through SupportSupport of R45 boken and confirmed as indicated - NOW NEW RESISTANCE
Next Strong Support - R39 - R40 - GOOD ENTRY POINT.
Should it break back through the R45 New resistance and confirm ----- ALSO GOOD ENTRY POINT to reach next resistance of about R55.
Wait before enter......
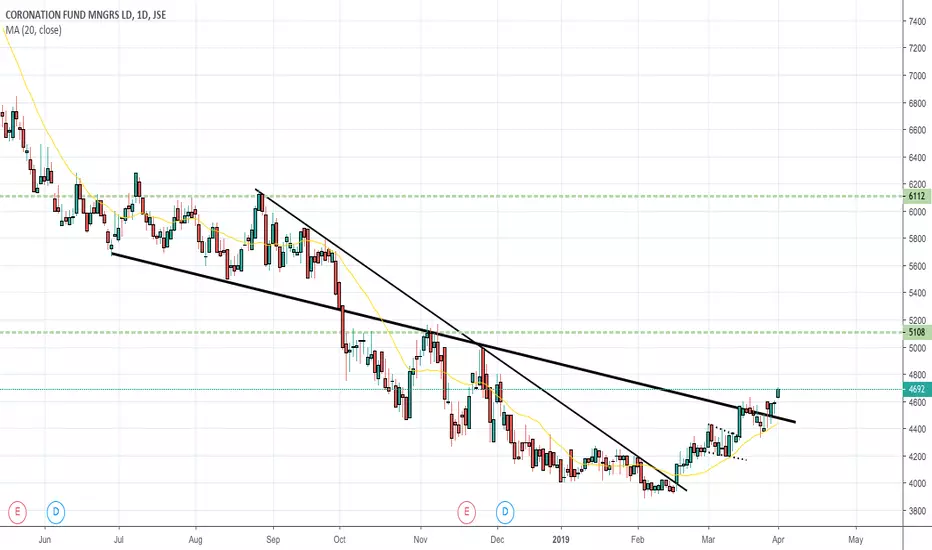
JSE:CML Coronation Next Leg DownCoronation found resistance at the yearly pivot point after looking strong. It has now been in a steady declining trend. After some redistribution, it looks like the next push down has started.

CML - On Support and near Oversold CML is on support line and very close to oversold territory
Made a false breakout as indicated and fell back again - confirming support.
I believe this is a good entry point ----- may rich R51 level.

Setup for a Juicy ShortSeen this play out all too many times
I would like to short the Major Supply in the Pivot extension

$JSECML - from Zero to Hero!#Coronation YTD performance is currently 29.6% & remaining one of my favorites. It recently had a nice breakout, with moving averages looking friendlier. Both 5yr & 10yr Market Cap/Assets under Management % still indicate the company to be on cheaper side but getting close to fair value relative to International Asset Managers.
Technically the trend is getting a lot stronger. The share price however is however trading extremely overbought according to its 14 day RSI. Should the share price take a bit of a breather, first support level could be both the 200-day moving average & the top parallel trendline at R49.03. Should we breakthrough those level, next supporting levels could be R46 and then the 50-day moving average R44.13 (stop loss).
I’m however still positive about $JSECML over the longer term and still eyeing that 0.382 Fibonacci retracement level at R57.02. That correlates quite nicely with the current Thomson Reuters consensus target price of R56.80 on the company.

Coronation R56Nice Cup formation at this stage with resistance at about R56 to start forming handle. R51 as new support. If breakthrough R56.... may rich R61-R62. But in overbought territory which may hamper suggestion.

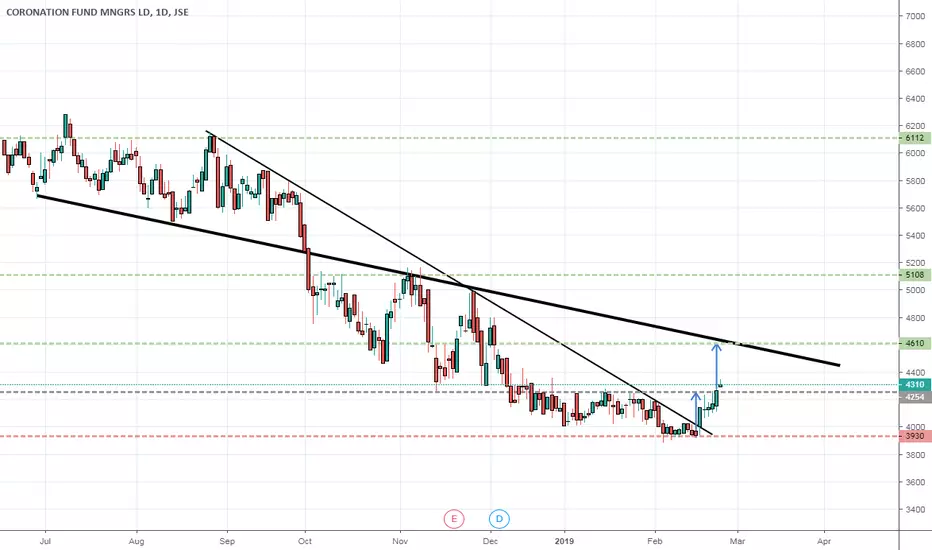
Worth a nibble Broken downward sloping resistance + RSI divergence. Could really get going above R42.50 resistance.


$JSECML...a recovery on steriods currentlyGreat recovery coming from Coronation, with another +/- 5% run again today, bringing the YTD performance now to double-figures. After the 20-day moving average broke above the 50-day on the 4th of March, the trend definitely became a bit stronger and now look a lot healthier. The 14-day RSI is closing in on the 70 mark, which does place the share now close to short-term “oversold” territory. I’m however already long, with a longer view on the company. I’m therefore not going to be too phased about any short-term noise for now. My target for now is both the 200-day moving average at R50.25, which is also the 0.236 Fibonacci retracement resistance level. A break above this level, could see us test R57 again.
Should we see a reversal in the trend, my first alarmbell will ring at R41.50 (50-day moving average), with huge horizontal support at R39.15. A break below this level does spell serious trouble, with the diagonal trend line at R36.25 then coming into play.
I’m still happy with the Thomson Reuters consensus target of R54 and with a historic Dividend Yield of 9.7% currently, I’m still very happy with this position.

Up against stiff resistance on the daily Taken half my position off here - stiff resistance so need to see what happens. Big move today too... Will look for possible re-entry


Re-testing R43.10 break out level Testing R43.10 break out level - also a potential bull flag forming. Close above R43.50 confirms flag and targets R45.60

Hourly close above R43.10 will trigger new buy signal Currently consolidating - hourly close above R43.10 will trigger new buy signal. Target = same as bull flag = R44.25

