Back to 140000? Capitec long ideaLooking at the current correction to complete as follows. First leg was 3 waves, expecting another 3 waves up to previous highs with another 3 down back to current levels to make a flat correction for more upside.
Got a bit carried away with this one.
CPI trade ideas

$JSE-CPIJSE:CPI
Not bothered with sell off that goes on JSE and rest of the world.
Stuck in box for last 2 weeks or so.
Watch for break one way or the other.

Capitec analysis update. Any criticism or advise is welcomed, just starting out on Elliott Wave analysis. Initial analysis was around 16 August.

CPI - counter-trend rally possible?Crossing above its 13- and 21-day simple moving averages. First bullish crossing in the last 44 days!
Bullish ParSAR crossing. First signal in the last 6 days.
Crossing above its 8-day linear regression line. First crossing in the last 28 days!
RSI on weekly chart is at a reading of 22. Oversold.
RSI on monthly chart is at a reading of 39. Moderate oversold.
RSI on daily chart retracted from oversold territory.
Is a counter-trend idea. Adjust risk accordingly. Remains in a declining channel pattern (see the black parallel lines).
Time to exit: +-/ 16 September 2019.


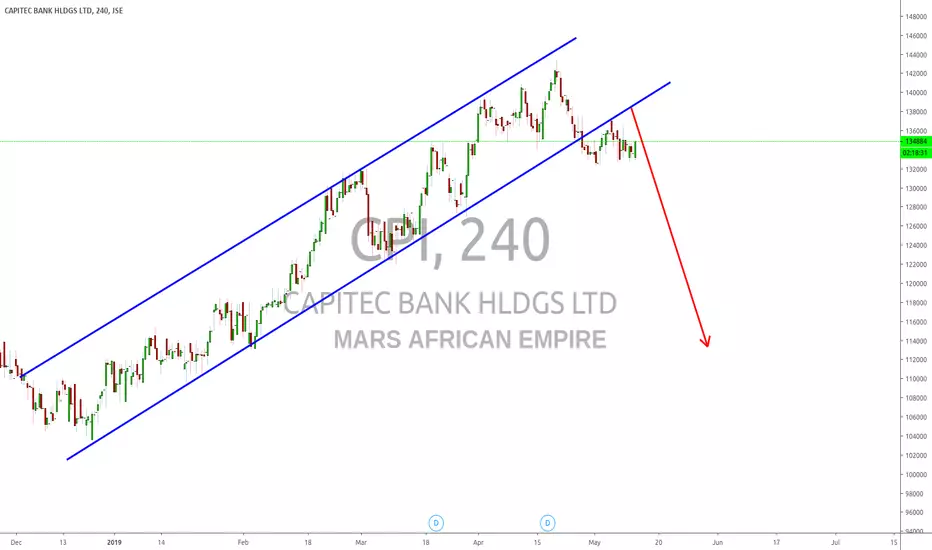
CAPITEC | New entrants into the market will be a problemTechnically, I like Capitec for a short to medium-term sell down to R1095 (currently trading around the R1284 mark).
First step is to wait for the weekly close. If price closes below the upper trendline I've drawn in, that would suggest that the recent highs just aren't going to hold. I don't expect an aggressive fall, but I don't see serious buyers coming in until the R1095 area at the earliest.
How price behaves at that point will give me an indication as to whether I want to hold for more downside, or cash out.
Fundamentally, CPI is in an interesting place. A typically resilient stock, but with a headwind.
Standard Bank are closing 104 branches in an increasingly difficult market, encouraging their clients to use more online services.
Capitec (although recently having acquired Mercantile Bank, helping speed up its entry into the business market) is heavily retail and branch focused. Up until recently Capitec provided the kind of services that were not available elsewhere in SA, at the cost Capitec offered its clients. However, this has changed with the arrival of Tyme Bank for one, and soon Bank Zero, a business underpinned by the hardwork successes of serial entrepreneur Michael Jordaan.
What is Capitec's answer to competitors that offer what they do, at better rates (some are zero feed accounts) with far fewer overheads?

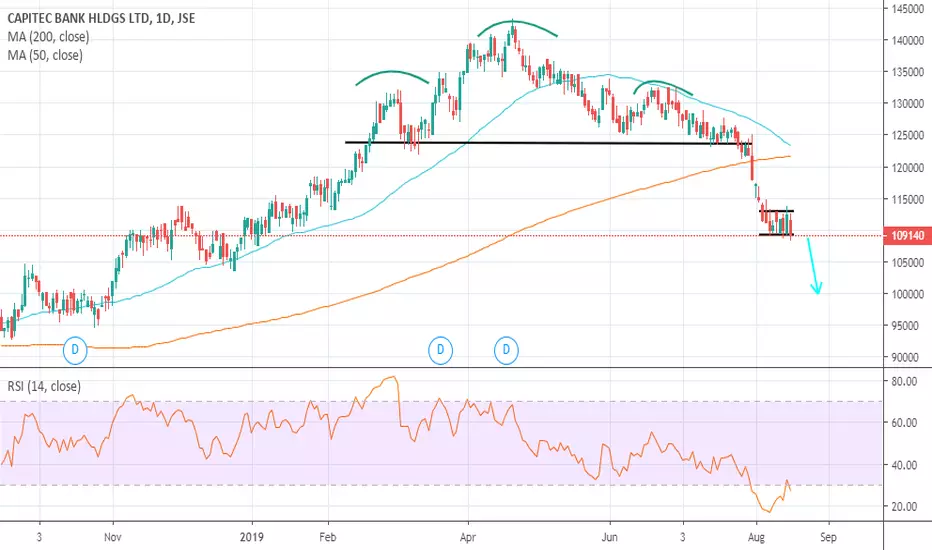
Capitec consolidating for a move lower?Having missed the 'short' opportunity on the break of that H&S neckline, CPI seem to be consolidating for a further move lower.
I'm patiently waiting for a break of that consolidation range to pull my short gun!
Anticipating an upswing on CPIJSE:CPI is trading around a support level formed in December 2017. I am anticipating an upswing and will look to enter long if confirmed.
The stochastic is looking like it is confirming the signal.


CPI Bounce off support zoneJSE:CPI has bounced off of quite a significant support level and is looking like it could be on its way up if it convincingly takes out the fractal from the 19th

$JSECPI - Retest of TL #Capitec broke TL support and is now retesting it. A reversal candle from here could open up an opportunity to short.

CPI - Weekly AnalysisWe may derive the following from the Weekly CPI chart:
1. Price broke a sharp uptrend.
2. We are still in an OVERALL uptrend. BUT price may be setting up for a move down. I think a bearish setup is likely.
3. It is still early to make a decision and so patience is needed to see if we form a potential sell or buy pattern.
4. As always - maintain your risk.
Note: The views provided herein do not constitute financial advice.

$JSECPI - Close to TL suport.#Capitec close to testing TL support as 1325.35 provides minor resistance.

CPI Piercing LineJSE:CPI formed a piercing line pattern with Friday's close which is a bottom reversal signal.
After a preceding downtrend, the green candle opens below the previous day's close and above the middle point of the red real body. It is a bottom reversal signal, but the candles MUST be different colours.

short idea for CPIis this the beginning of the fall of the mighty capitec? classic head and shoulder

capitec holdings bearshead&shoulders pattern taking place in this stock bears are coming strong after the neckline stops are in Oder in case im wrong.

CApitec Falls??We been seeing capitec going up and up, i think now its time we see it falling and falling
JSE:CPI Capitec Re-accumulation or DistributionAfter breaking the upward stride and going overbought Capitec is now consolidating. It is busy breaking back into the trend channel. After a buying climax (BC), automatic reaction (AR) and secondary test (ST) in phase A we now have seen an upthrust (UT) in phase B. This is showing some strength but was on low volume and divergence with the volume RSI. Now to watch how the TR develops to see if it is a distribution or re-accumulation. For now, I am expecting the price to range for some time.


CAPITEC BANK (CPI) DAILY TIMEFRAME LONGUptrends rarely come as crystal clear as this. I feel bad for not having bought this stock earlier even though i stay in South Africa where it is listed. However, for all those traders like me who missed the initial rally, i expect prices to go up further. A good place to enter a long position would be if price retraces to the 134290 price level.
Traders can also enter on the retest of either the 20- or 50-period exponential moving average (EMA), which are both currently acting as dynamic support.
Remember, a trend is your friend (why fight it?)
