DSY trade ideas

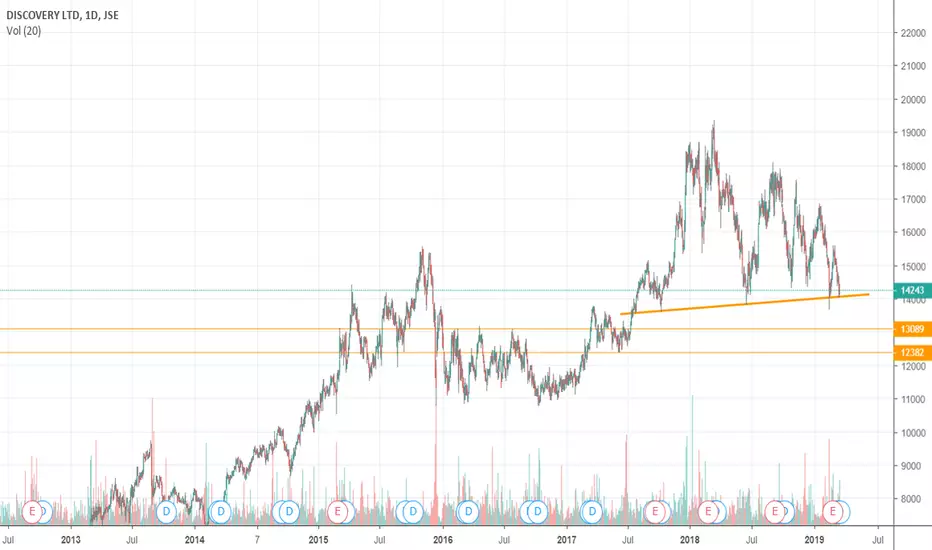
$JSEDSY Discovery trading on supportMaking lower highs recently and now on support, a break of support could mean a test of lower levels 13000, 12400. Wait for a break on this one. We could see another lower high before then.
JSE:DSY Discovery Spring or Test in Phase BAfter a Selling Climax (SC), Automatic Rally (AR) and Secondary Test (ST) in Phase A we have now seen the bottom of the range being tested a second time. This looks a lot like a potential spring in Phase C but we have not seen a good contraction in volume in Phase B so this still could just be a test of the TR. However, the result should be the same with a test of the top of the TR. We have seen a significant bar confirming the reversal.


Strong Support on DSYJSE:DSY is trading at a strong support level at the moment.
It has bounced off of this level forming a hammer candle pattern which indicates a loss of bearish momentum and is a strong reversal signal.
Coupled with this, the stochastic has turned upwards which makes the signal stronger.
I have entered a long position, aiming for the next resistance level.

Long Top5 oversold/overbought according to RSI & $JSEDSYEnd of week 15Feb19. Another week dominated by Resources. FTSE/JSE Allshare ( JSE:J203 ) Top5 oversold/overbought according to 14day RSI indicator as follow:
JSE:OMN 14
JSE:WBO 16
JSE:DSY 23
JSE:TON 23
JSE:MNK 28
JSE:IMP 83
JSE:AMS 80
JSE:KIO 80
JSE:BHP 79
JSE:SGL 75
Spending a few minutes on one of the most oversold companies of the week (according to RSI ), namely Discovery.
Technically it broke it's long-term bullish trend started in October 2017. This was due to a very negative trading statement released yesterday, stating that Discovery's normalised undiluted headline earnings per share for the six months ended 31 December 2018, is expected to decrease by approximately 16% to 366.6 cps (2017: 438.5 cps) compared to the prior comparative period. They contributed this negative surprise on the spend on new businesses, which increased significantly over the period. They further stated that this will amount to approximately 21% of Group earnings.
Last week ( I felt that Pik'nPay could be due for a bounce, but this week I'm worried about Discovery. Buying it at current levels could be like catching falling knifes, seeing that both the 50-day & 200-day moving averages are still very much pointing downwards. I would therefore hold off on buying too soon.
Next resistance should be around R139.79, with a break most probably testing the R127.76 levels.
Should the share recover and break R149.50 soon, then 50-day moving average at R156.42 should be next resistance.
Personally, I'm going to wait for this one to turn the tide a bit.

DSY holding UP I'm looking to buy DSY at around R144.00. It's holding up nicely at that horizontal support in a wedge pattern. the next move could likely be back towards the top of this wedge. Investors seem to have shrugged off their soft results and that bodes well for some bullish price action

$JSE-DSYJSE:DSY
Made hammer on massive volume on Friday on big support.
This can be nice long with stop loss bellow Friday's low.


Discovery Correction With Big TargetsDiscovery Ltd. is listed on the Johannesburg Stock Exchange and is an integrated financial services organisation, specialising in health insurance, life assurance, wellness, investments, savings products, short-term insurance and credit card products.
Technicals
The corrective structure indicated above has targets of between 19000 and 21000 which is a long way up. We are in wave 3 of a possible 5 of the correction. I will be looking for wave 3 to break the low of wave 1 before looking for reversal signs to enter the long.
Happy trading!
Linton

$JSEDSYJSE:DSY
Broke from symmetrical triangle on hourly chart this morning. More downside to come
$JSEDSY should retrace some 10% or so

JSE:DSY Discovery showing strengthDiscovery (JSE:DSY) is showing strong leadership as compared the JSE Wyckoff Wave (10 Core JSE stocks). The OBV is indicating bullish pressure. The stock has broken the 200 Day SMA, is above the Monthly and Yearly Pivot Points and is now pushing up against a significant volume cluster at 180 formed by the consolidation at the previous highs. On Thursday there was significant volume pushing up to this level and the JSE Top40 has also shown strength. If price pushes above the 180 level, the previous high could be tested with momentum behind it.
