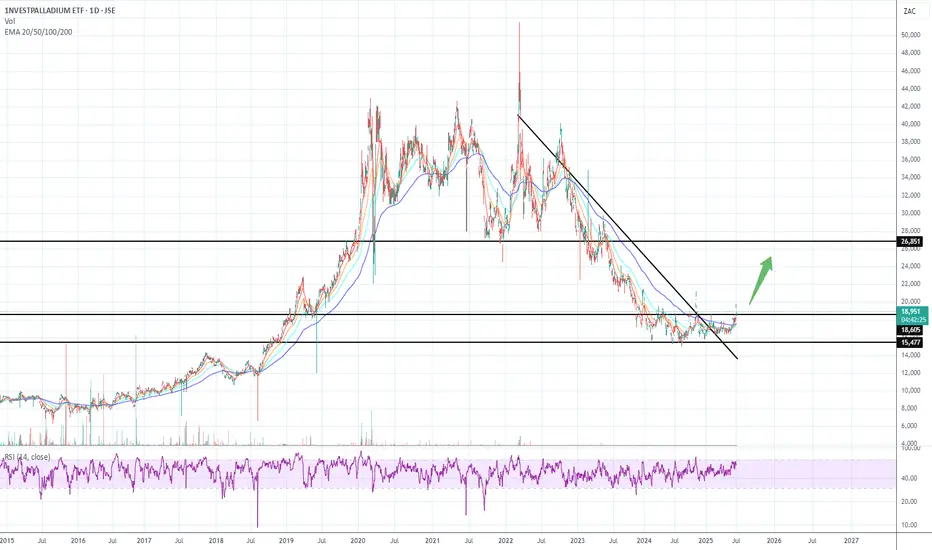
Palladium looking to rebound after consolidationPalladium has had a lengthy price consolidation after a deep retracement. Breakout underway, with attractive upside potential.
Key stats
About 1NVESTPALLADIUM ETF
Home page
Inception date
Mar 24, 2014
Replication method
Physical
Dividend treatment
Capitalizes
Primary advisor
STANLIB Collective Investments (RF) Pty Ltd.
ISIN
ZAE000182531
1nvest ETFs precious metal Exchange Traded Funds (ETFs) are designed to offer ETF unit holders a secured, simple and cost-efficient way to access the precious metal market.
Related funds
Classification
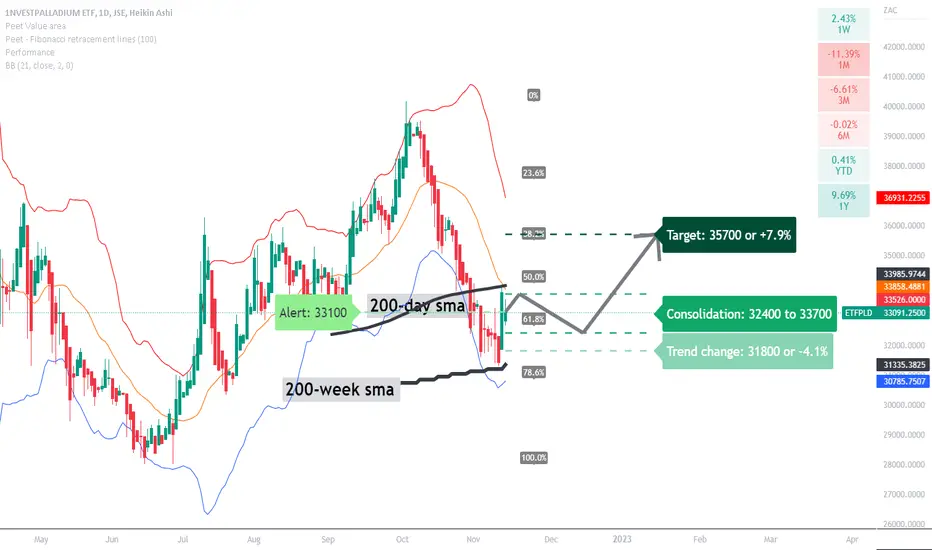
ETFPLD: might we see some upside potential?A price action above 31800 supports a bullish trend direction.
A price action below this level will negate the bullish stance.
Further bullish trend support above 33100.
Consolidation price range from 32400 to 33700.
Crossing above 33700 will also support the price action to target 35700.
Crossing
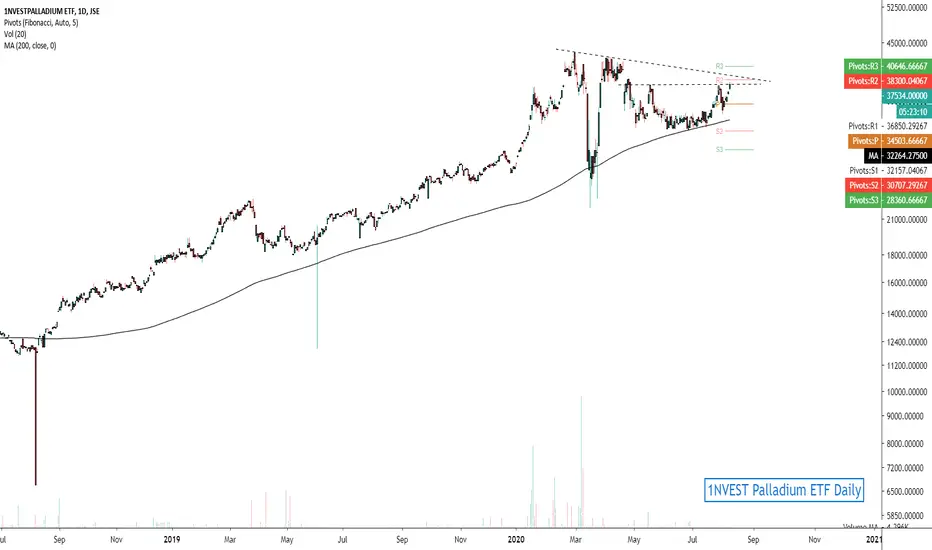
1NVEST Palladium ETFWeekly Chart
The daily chart of the 1NVEST Palladium ETF is a local vehicle to gain exposure to the potential move, with the price also having consolidated year-to-date. A push above 38900 is a trigger for higher levels and potential continuation of the upward trend.
Time Frame: Medium Term
(Se
See all ideas
Summarizing what the indicators are suggesting.
Oscillators
Neutral
SellBuy
Strong sellStrong buy
Strong sellSellNeutralBuyStrong buy
Oscillators
Neutral
SellBuy
Strong sellStrong buy
Strong sellSellNeutralBuyStrong buy
Summary
Neutral
SellBuy
Strong sellStrong buy
Strong sellSellNeutralBuyStrong buy
Summary
Neutral
SellBuy
Strong sellStrong buy
Strong sellSellNeutralBuyStrong buy
Summary
Neutral
SellBuy
Strong sellStrong buy
Strong sellSellNeutralBuyStrong buy
Moving Averages
Neutral
SellBuy
Strong sellStrong buy
Strong sellSellNeutralBuyStrong buy
Moving Averages
Neutral
SellBuy
Strong sellStrong buy
Strong sellSellNeutralBuyStrong buy
Displays a symbol's price movements over previous years to identify recurring trends.
Frequently Asked Questions
An exchange-traded fund (ETF) is a collection of assets (stocks, bonds, commodities, etc.) that track an underlying index and can be bought on an exchange like individual stocks.
ETFPLD trades at 19,551 ZAC today, its price has fallen −1.71% in the past 24 hours. Track more dynamics on ETFPLD price chart.
ETFPLD net asset value is 215.13 today — it's risen 5.46% over the past month. NAV represents the total value of the fund's assets less liabilities and serves as a gauge of the fund's performance.
ETFPLD assets under management is 53.17 M ZAC. AUM is an important metric as it reflects the fund's size and can serve as a gauge of how successful the fund is in attracting investors, which, in its turn, can influence decision-making.
ETFPLD price has risen by 5.16% over the last month, and its yearly performance shows a 27.22% increase. See more dynamics on ETFPLD price chart.
NAV returns, another gauge of an ETF dynamics, have risen by 5.46% over the last month, showed a 21.98% increase in three-month performance and has increased by 24.94% in a year.
NAV returns, another gauge of an ETF dynamics, have risen by 5.46% over the last month, showed a 21.98% increase in three-month performance and has increased by 24.94% in a year.
ETFPLD fund flows account for −881.97 M ZAC (1 year). Many traders use this metric to get insight into investors' sentiment and evaluate whether it's time to buy or sell the fund.
Since ETFs work like an individual stock, they can be bought and sold on exchanges (e.g. NASDAQ, NYSE, EURONEXT). As it happens with stocks, you need to select a brokerage to access trading. Explore our list of available brokers to find the one to help execute your strategies. Don't forget to do your research before getting to trading. Explore ETFs metrics in our ETF screener to find a reliable opportunity.
No, ETFPLD isn't leveraged, meaning it doesn't use borrowings or financial derivatives to magnify the performance of the underlying assets or index it follows.
In some ways, ETFs are safe investments, but in a broader sense, they're not safer than any other asset, so it's crucial to analyze a fund before investing. But if your research gives a vague answer, you can always refer to technical analysis.
Today, ETFPLD technical analysis shows the sell rating and its 1-week rating is buy. Since market conditions are prone to changes, it's worth looking a bit further into the future — according to the 1-month rating ETFPLD shows the neutral signal. See more of ETFPLD technicals for a more comprehensive analysis.
Today, ETFPLD technical analysis shows the sell rating and its 1-week rating is buy. Since market conditions are prone to changes, it's worth looking a bit further into the future — according to the 1-month rating ETFPLD shows the neutral signal. See more of ETFPLD technicals for a more comprehensive analysis.
No, ETFPLD doesn't pay dividends to its holders.
ETFPLD trades at a premium (9.12%).
Premium/discount to NAV expresses the difference between the ETF’s price and its NAV value. A positive percentage indicates a premium, meaning the ETF trades at a higher price than the calculated NAV. Conversely, a negative percentage indicates a discount, suggesting the ETF trades at a lower price than NAV.
Premium/discount to NAV expresses the difference between the ETF’s price and its NAV value. A positive percentage indicates a premium, meaning the ETF trades at a higher price than the calculated NAV. Conversely, a negative percentage indicates a discount, suggesting the ETF trades at a lower price than NAV.
ETFPLD shares are issued by Standard Bank Group Ltd.
ETFPLD follows the Palladium London PM Fix ($/ozt). ETFs usually track some benchmark seeking to replicate its performance and guide asset selection and objectives.
The fund started trading on Mar 24, 2014.
The fund's management style is passive, meaning it's aiming to replicate the performance of the underlying index by holding assets in the same proportions as the index. The goal is to match the index's returns.