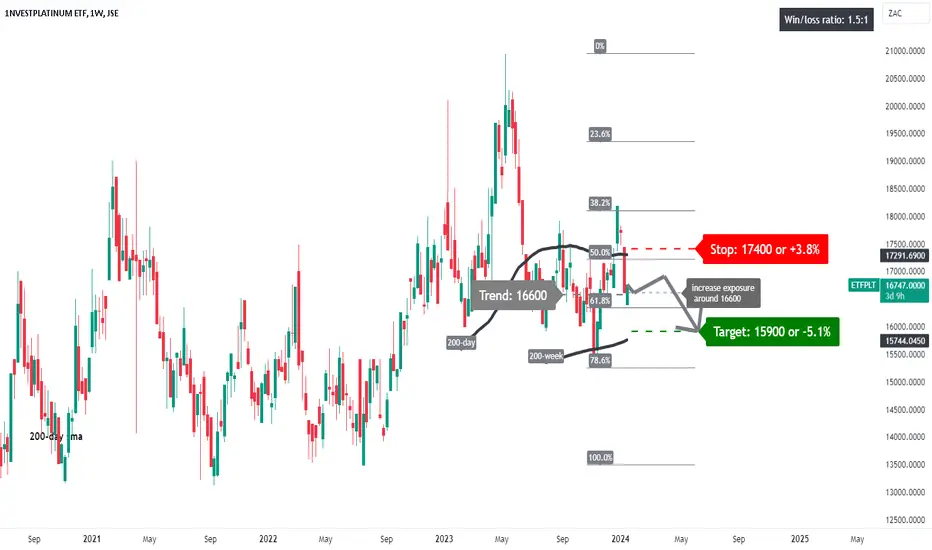
ETFPLT: shallow correction?A price action below 16600 supports a bearish trend direction.
Recently crossed below its 200-day simple moving average.
Expect further downside potential for a break below the mentioned 16600 price level.
The target price is set at 15900 (its 200-week simple moving average).
The stop-loss price is
Key stats
About 1NVESTPLATINUM ETF
Home page
Inception date
Apr 7, 2014
Replication method
Physical
Income tax type
Capital Gains
Primary advisor
STANLIB Collective Investments (RF) Pty Ltd.
ISIN
ZAE000182556
1nvest Platinum ETFs are backed by physical platinum, stored and insured in secured custodian vaults
Related funds
Classification
Summarizing what the indicators are suggesting.
Oscillators
Neutral
SellBuy
Strong sellStrong buy
Strong sellSellNeutralBuyStrong buy
Oscillators
Neutral
SellBuy
Strong sellStrong buy
Strong sellSellNeutralBuyStrong buy
Summary
Neutral
SellBuy
Strong sellStrong buy
Strong sellSellNeutralBuyStrong buy
Summary
Neutral
SellBuy
Strong sellStrong buy
Strong sellSellNeutralBuyStrong buy
Summary
Neutral
SellBuy
Strong sellStrong buy
Strong sellSellNeutralBuyStrong buy
Moving Averages
Neutral
SellBuy
Strong sellStrong buy
Strong sellSellNeutralBuyStrong buy
Moving Averages
Neutral
SellBuy
Strong sellStrong buy
Strong sellSellNeutralBuyStrong buy
Displays a symbol's price movements over previous years to identify recurring trends.
Frequently Asked Questions
An exchange-traded fund (ETF) is a collection of assets (stocks, bonds, commodities, etc.) that track an underlying index and can be bought on an exchange like individual stocks.
ETFPLT trades at 24,070 ZAC today, its price has risen 3.98% in the past 24 hours. Track more dynamics on ETFPLT price chart.
ETFPLT net asset value is 233.08 today — it's risen 7.42% over the past month. NAV represents the total value of the fund's assets less liabilities and serves as a gauge of the fund's performance.
ETFPLT assets under management is 2.62 B ZAC. AUM is an important metric as it reflects the fund's size and can serve as a gauge of how successful the fund is in attracting investors, which, in its turn, can influence decision-making.
ETFPLT price has risen by 15.17% over the last month, and its yearly performance shows a 40.65% increase. See more dynamics on ETFPLT price chart.
NAV returns, another gauge of an ETF dynamics, have risen by 7.42% over the last month, showed a 33.68% increase in three-month performance and has increased by 33.39% in a year.
NAV returns, another gauge of an ETF dynamics, have risen by 7.42% over the last month, showed a 33.68% increase in three-month performance and has increased by 33.39% in a year.
ETFPLT fund flows account for 30.75 B ZAC (1 year). Many traders use this metric to get insight into investors' sentiment and evaluate whether it's time to buy or sell the fund.
Since ETFs work like an individual stock, they can be bought and sold on exchanges (e.g. NASDAQ, NYSE, EURONEXT). As it happens with stocks, you need to select a brokerage to access trading. Explore our list of available brokers to find the one to help execute your strategies. Don't forget to do your research before getting to trading. Explore ETFs metrics in our ETF screener to find a reliable opportunity.
No, ETFPLT isn't leveraged, meaning it doesn't use borrowings or financial derivatives to magnify the performance of the underlying assets or index it follows.
In some ways, ETFs are safe investments, but in a broader sense, they're not safer than any other asset, so it's crucial to analyze a fund before investing. But if your research gives a vague answer, you can always refer to technical analysis.
Today, ETFPLT technical analysis shows the strong buy rating and its 1-week rating is buy. Since market conditions are prone to changes, it's worth looking a bit further into the future — according to the 1-month rating ETFPLT shows the strong buy signal. See more of ETFPLT technicals for a more comprehensive analysis.
Today, ETFPLT technical analysis shows the strong buy rating and its 1-week rating is buy. Since market conditions are prone to changes, it's worth looking a bit further into the future — according to the 1-month rating ETFPLT shows the strong buy signal. See more of ETFPLT technicals for a more comprehensive analysis.
No, ETFPLT doesn't pay dividends to its holders.
ETFPLT trades at a premium (3.27%).
Premium/discount to NAV expresses the difference between the ETF’s price and its NAV value. A positive percentage indicates a premium, meaning the ETF trades at a higher price than the calculated NAV. Conversely, a negative percentage indicates a discount, suggesting the ETF trades at a lower price than NAV.
Premium/discount to NAV expresses the difference between the ETF’s price and its NAV value. A positive percentage indicates a premium, meaning the ETF trades at a higher price than the calculated NAV. Conversely, a negative percentage indicates a discount, suggesting the ETF trades at a lower price than NAV.
ETFPLT shares are issued by Standard Bank Group Ltd.
ETFPLT follows the No Underlying Index. ETFs usually track some benchmark seeking to replicate its performance and guide asset selection and objectives.
The fund started trading on Apr 7, 2014.
The fund's management style is active, aiming to outperform its benchmark index by actively selecting and adjusting assets. The goal is to achieve returns that exceed those of the index the fund tracks.