1.5 million per oz of Rhodium by 2027?Not too far away we may be seeing a radically different world.
I'm more scared of revolutions than losing out.
But that's the nature of our fraudulent political system.
Key stats
About 1NVESTRHODIUM ETF
Home page
Inception date
Dec 4, 2015
Replication method
Physical
Dividend treatment
Capitalizes
Primary advisor
STANLIB Collective Investments (RF) Pty Ltd.
ISIN
ZAE000210787
1nvest ETFs precious metal Exchange Traded Funds (ETFs) are designed to offer ETF unit holders a secured, simple and cost-efficient way to access the precious metal market.
Related funds
Classification

Rhodium ETF 1nvest Fib StudyThis is a study on the Rhodium ETF 1nvest Fib Study.
Some support has been seen around the R650 level. But still early days.
Should this level be maintained, I've plotted the Fibonacci Levels to see where the Trend might be in a few years time.
NOTE: This only for Education Purposes and not any advi

Rhodium etf long $ssw $sbswThere has been some stealth buying of the Rhodium etf, an etf with low liquidity, but someone has been very careful to keep a low profile . For a few days now there has been some gap ups. Today there is a breakout. No doubt this will be subject to volatility, but a breakout is a breakout. Let's see

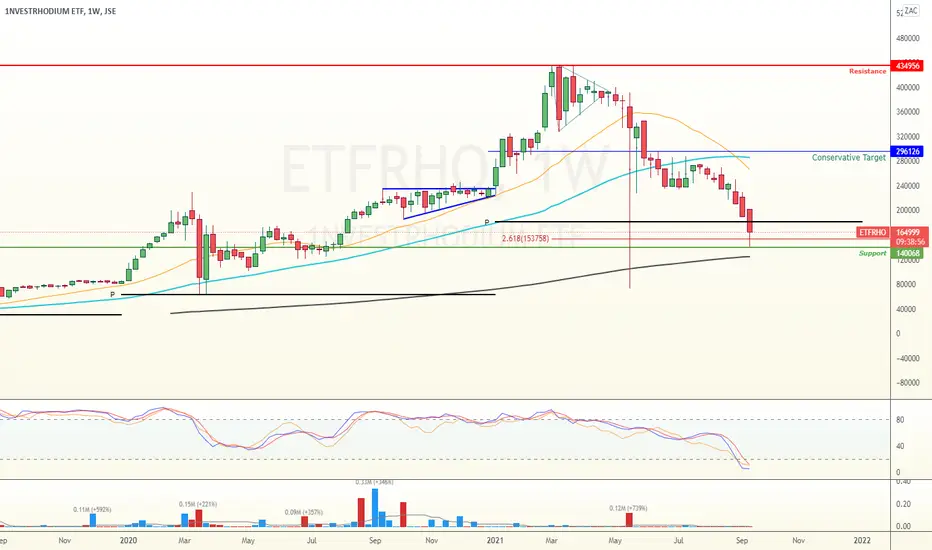
What's going on with Rhodium? Rhodium Down
-30% - 1Week
-45% - 1 Month
-60% - 6 Months
Severely Hurting certain PGM Miners!
I can't get the Fibonacci Retracements to work here!
Could someone better qualified have a look,
and redo this chart correctly please!

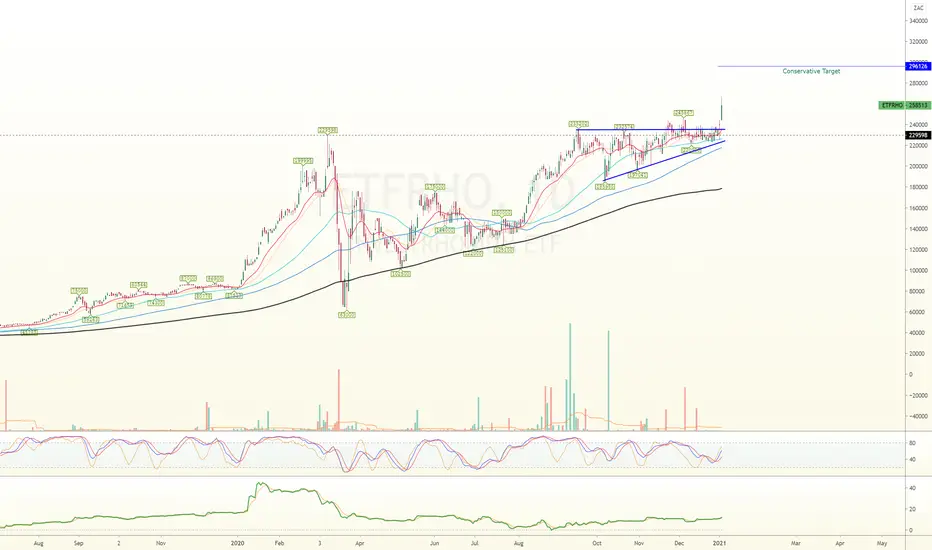
Symmetrical and Ascending Triangle w/SLSymmetrical triangles are signs of continuation of a momentum, and usually the target is the height of tha triangle's base, which it reached. There is also an ascending (bullish) triangle forming shortly aferwards in this 1W period chart. You can see the importance to place a Stop Loss: in this case

RHODIUM - Area of interest- After a successful long trade (link below) , Rhodium has come back quite aggressively and has entered a level of interest ...
- I will be watching for signs of support over the coming sessions to start building a long position IF price can find some bedrock
-- MANAGE YOUR RISK - -
Disclaimer:
Rhodium ETF - Making new highs- Bullish uptrend , breaking out of a flat top triangle formation
-- MANAGE YOUR RISK - -
Disclaimer: All ideas are my opinion and should not be taken as financial advice.
JSE:ETFRHO

Rhodium is heading for a total supply shortfall vs demand.Rhodium is not something traded widely and something not studied closely. What is clear is that the market is in deficit and not something that can be done to correct this . The bulk of Rodium is mined is South Africa . It is mined as a byproduct from Mining PGM's as 1 to 11% of PGM's (basket of met

#Rhodium - ETFRHO breaking out. Rhodium breaking out from a large triangle. Bullish if it holds on the close.

See all ideas
Summarizing what the indicators are suggesting.
Oscillators
Neutral
SellBuy
Strong sellStrong buy
Strong sellSellNeutralBuyStrong buy
Oscillators
Neutral
SellBuy
Strong sellStrong buy
Strong sellSellNeutralBuyStrong buy
Summary
Neutral
SellBuy
Strong sellStrong buy
Strong sellSellNeutralBuyStrong buy
Summary
Neutral
SellBuy
Strong sellStrong buy
Strong sellSellNeutralBuyStrong buy
Summary
Neutral
SellBuy
Strong sellStrong buy
Strong sellSellNeutralBuyStrong buy
Moving Averages
Neutral
SellBuy
Strong sellStrong buy
Strong sellSellNeutralBuyStrong buy
Moving Averages
Neutral
SellBuy
Strong sellStrong buy
Strong sellSellNeutralBuyStrong buy
Displays a symbol's price movements over previous years to identify recurring trends.
Frequently Asked Questions
An exchange-traded fund (ETF) is a collection of assets (stocks, bonds, commodities, etc.) that track an underlying index and can be bought on an exchange like individual stocks.
ETFRHO trades at 90,413 ZAC today, its price has risen 2.00% in the past 24 hours. Track more dynamics on ETFRHO price chart.
ETFRHO net asset value is 895.30 today — it's fallen 1.83% over the past month. NAV represents the total value of the fund's assets less liabilities and serves as a gauge of the fund's performance.
ETFRHO assets under management is 573.22 M ZAC. AUM is an important metric as it reflects the fund's size and can serve as a gauge of how successful the fund is in attracting investors, which, in its turn, can influence decision-making.
ETFRHO price has fallen by −0.58% over the last month, and its yearly performance shows a 18.19% increase. See more dynamics on ETFRHO price chart.
NAV returns, another gauge of an ETF dynamics, have risen by −1.83% over the last month, have fallen by −1.83% over the last month, showed a −8.56% decrease in three-month performance and has increased by 9.99% in a year.
NAV returns, another gauge of an ETF dynamics, have risen by −1.83% over the last month, have fallen by −1.83% over the last month, showed a −8.56% decrease in three-month performance and has increased by 9.99% in a year.
ETFRHO fund flows account for 39.59 B ZAC (1 year). Many traders use this metric to get insight into investors' sentiment and evaluate whether it's time to buy or sell the fund.
Since ETFs work like an individual stock, they can be bought and sold on exchanges (e.g. NASDAQ, NYSE, EURONEXT). As it happens with stocks, you need to select a brokerage to access trading. Explore our list of available brokers to find the one to help execute your strategies. Don't forget to do your research before getting to trading. Explore ETFs metrics in our ETF screener to find a reliable opportunity.
No, ETFRHO isn't leveraged, meaning it doesn't use borrowings or financial derivatives to magnify the performance of the underlying assets or index it follows.
In some ways, ETFs are safe investments, but in a broader sense, they're not safer than any other asset, so it's crucial to analyze a fund before investing. But if your research gives a vague answer, you can always refer to technical analysis.
Today, ETFRHO technical analysis shows the sell rating and its 1-week rating is neutral. Since market conditions are prone to changes, it's worth looking a bit further into the future — according to the 1-month rating ETFRHO shows the sell signal. See more of ETFRHO technicals for a more comprehensive analysis.
Today, ETFRHO technical analysis shows the sell rating and its 1-week rating is neutral. Since market conditions are prone to changes, it's worth looking a bit further into the future — according to the 1-month rating ETFRHO shows the sell signal. See more of ETFRHO technicals for a more comprehensive analysis.
No, ETFRHO doesn't pay dividends to its holders.
ETFRHO trades at a premium (0.47%).
Premium/discount to NAV expresses the difference between the ETF’s price and its NAV value. A positive percentage indicates a premium, meaning the ETF trades at a higher price than the calculated NAV. Conversely, a negative percentage indicates a discount, suggesting the ETF trades at a lower price than NAV.
Premium/discount to NAV expresses the difference between the ETF’s price and its NAV value. A positive percentage indicates a premium, meaning the ETF trades at a higher price than the calculated NAV. Conversely, a negative percentage indicates a discount, suggesting the ETF trades at a lower price than NAV.
ETFRHO shares are issued by Standard Bank Group Ltd.
ETFRHO follows the Rhodium Spot Price - ZAR - Benchmark Price Return. ETFs usually track some benchmark seeking to replicate its performance and guide asset selection and objectives.
The fund started trading on Dec 4, 2015.
The fund's management style is passive, meaning it's aiming to replicate the performance of the underlying index by holding assets in the same proportions as the index. The goal is to match the index's returns.