Bullish Engulfing on ExxaroA bullish engulfing candle pattern has formed on JSE:EXX . This is a bottom reversal signal, so we could see a move up to around the R22 level.
EXX trade ideas


EXX - Possible ShortThe stochastic, MACD and now the two EMA's are all showing possible signs of a short coming up on JSE:EXX . If it continues lower, we will enter short. Target around the 184 level.

EXX - Full Target Reached (R220)EXX - Full Target Reached (R220) on the back of it's results. Original trade idea attached.

EXX - UpdateUpdate: EXX - high of day of 21922c, a few cents shy of the 22000c target.
So far +6% on the day. Original idea attached.

EXXExxaro Resources EXX: Possible buy/long trade on trigger.
How I'm seeing it:
The 19000c level was an important demand-supply zone. The share found support and has continued to develop a potential bull flag.
May be continue consolidation in ultra short term however, trigger is breach of downward trend line.
Provisional Levels:
Current: 19863c
Target: 22000c
Stop-loss: 19200c
For more research, including trade ideas, get in touch today.

EXXARO - Ominous Head and Shoulders - As per the previous post (link below) EXXARO consolidated and allowed the 20ema to catch up before breaking the flag and reaching a swing high of R240
- The chart has since printed what seems to be an ominous Head and Shoulders pattern ....
- The neckline sits around the previous break level R191 (Range R191-R220)
- The 50 day has also started to slope downwards so i would not be surprised to see the level tested and perhaps visit the 200day at around R186
- Above R225 negates the head and shoulders
-- MANAGE YOUR RISK - -
Disclaimer: All ideas are my opinion and should not be taken as financial advice.
If you would like me to have a look at any chart, please send me a message and i will post my thoughts, Happy Trading!

Short triggered on ExxaroA short has been triggered on JSE:EXX this morning slightly below our desired level as it gapped down with the opening. We are looking for a move down to the 176 level.

AG Capital -Storm trading Morning Call 6 April 2022We give a quick recap of markets overnight and the previous day and insights into the day ahead with a few trade ideas on the day. Ideas are strictly NOT INVESTMENT ADVICE.

EXXARO - Swing High (Update)Exxaro has arrived at its previous swing highs. I will be paying close attention to how it reacts in the zone. Price may continue charging up or consolidate allowing the 20ma to catchup before making its next move...
Original posts
-- MANAGE YOUR RISK - -
Disclaimer: All ideas are my opinion and should not be taken as financial advice.

EXX long if it breaks previous highsJSE:EXX is looking good for a long position if it breaks the previous high formed on 20 Jan.

EXXARO - Out of accumulation zone (Update)Exxaro spent a fair amount of time since Oct 2021 in the accumulation area (built a falling wedge) , flushing to a low of R144.30 ...
Its now trending well upwards towards a likely test of swing highs (R190 zone)
-- MANAGE YOUR RISK - -
Disclaimer: All ideas are my opinion and should not be taken as financial advice.

Possible long opp in JSE:EXXPrice breaking out of this symmetrical traingle and closing above the EMA200. Decent spot for a long opp here. There is also a bullish MACD cross about to occur on the weekly chart. As always manage your risk

@VillageTraderZA - Exxaro holds support at 200 day EMAAn excellent risk reward opportunity on Exxaro as the stock holds the 200 day EMA with a bullish engulfing candle close on Friday. With a short term target R190 and a stop loss at R158. The stock might find a bit of resistance at the 50 EMA.

EXXARO - Looking to build a long position - Price is pulling back towards an area of accumulation and possible support zone
-- MANAGE YOUR RISK - -
Disclaimer: All ideas are my opinion and should not be taken as financial advice.

EXXARO - Upward channel with a Bullish HaramiJSE:EXX has been trading in an upward channel since the big gap that was formed towards the end of April. It reached the bottom of the channel and formed a bullish harami pattern as it reached the support level. This candle pattern is a strong bottom reversal pattern and could be a sign of a reversal. This, coupled with the bottom of the channel could mean we could see a move towards the top of the channel again.

Head and Shoulders breakoutThe Head and shoulder pattern break. If you remember the head formation was as a result of a giant Dividend. Price has since recovered


Another look at Long Idea on EXXPrice has formed a nice IHS setup here closing above the resistance level of 18400. A long position can be initiated with a ST limit of 20800. It would be prudent to observe price behavior at the 18900 level as this level has been tested previously with selloffs ensuing thereafter. ST and LT primary trends are up in this stock but as always apply your risk management and good luck out there.

Long idea on EXXPrice has eventually broken out and closed above the resistance level of 18400. A long position can be initiated with a ST limit of 20000. It would be prudent to observe price behavior at the 18900 level as this level has been tested previously with selloffs ensuing thereafter. ST and LT primary trends are up in this stock but as always apply your risk management and good luck out there.

EXX lifting the handle?Something's up with coal prices and it is pulling EXX up. Cup and Handle formation playing out.

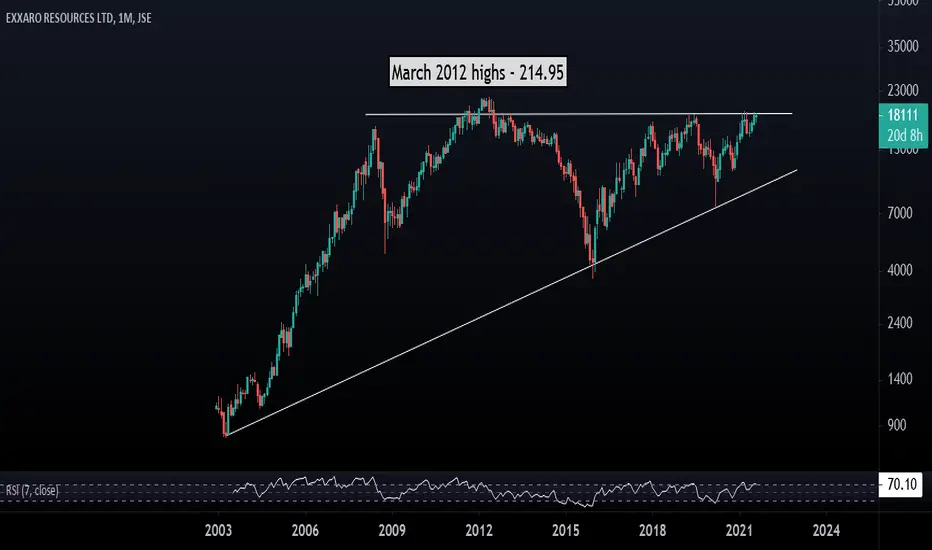
Exxaro Resources - Monthly Chart PerspectiveAn extract from my pre-market note.
Exxaro Resources (EXX, R177.38): We consider analysis of the monthly chart a key variable in our outlook. EXX has traded in a sideways range for 12 years and has the potential for upside acceleration to test the March 2012 highs at R214.95 on the back of a potential moderate fundamental re-rating post it’s results.
For the FULL note and more of these and other technical perspectives, get in touch with me today.