Why Trend Lines are Powerful with Trading The closest predictor indicators when it comes to trading are:
Price action and volume.
I’m going to talk a bit about Price action today as Volume is a whole different cattle of fish.
With TradingView charting platform there are a few indicators to identify a trend:
Trend lines, Bollinger Bands, Moving Averages, Candlesticks and other bands and channels too numerous to mention.
#1: Trend Lines – Trend detector
Trend lines are perfect for pointing out the direction of the market.
Trend lines are a useful tool for identifying the direction of a market. They are a straight line that is plotted through a series of data points.
You can either plot a straight diagonal line to determine whether the market is going up or down.
Or you can plot horizontal lines to identify ranges, sideways consolidation areas.
That’s because trend lines plot through a series of data points on the charts to help point out whether the trends are moving up down or sideways.
There are a number of benefits with using trend lines including:
• Trend directions
To help identify the overall direction of the market, whether it is trending up, down, or sideways.
• S&R levels
Point out key support (floor levels) and resistance (ceiling levels) These are great for points of entry.
• Chart patterns and breakout levels
Chart patterns are also used with trend lines. Especially neck lines, brim levels, box formations etc…
• Points of reversals
We also use trend lines to wait for a break in structure. Once this happens, we can see if the market is about to change direction and reverse.
• Convert chaos into order
End of the day all technical analysis and price action is used for confirmation bias. To apply to a strategy and to make calculated and informed decisions on what to do if something happens. Almost like a If this then That!
I’ve used trend lines and price action since 2003 and they remain an important element to trading analyses.
End of the day, the market can only move up, down and sideways.
And you know why?
Because the famous psychology of demand and supply will always work.
And so they are here to stay and we might as well take advantage of it.
J200 trade ideas

3 Awkward Stages for a Trader!There are three awkward stages that every successful trader will go through.
You can’t escape them.
And let me warn you. The more successful you become the more awkward the stages get.
Let’s get to them.
AWKWARD STAGE 1:
You are ridiculed
First when you start out as a trader, you get nothing but doubt from everyone around you.
You hear things like
“It’s a scam”
“You’ll blow your account”
“You won’t last long”
“Get a real career”
This stage is purely based on one reason. Those who doubt you are either not traders and are clueless or they failed themselves and are now basing their failure on others.
This can be quite demoralizing for you when you just get started.
Also this is the starting stage where you’re trying to find your feet.
I’d suggest you go where you are appreciated, rather than tolerated and ridiculed.
Find a community of members that are starting out and a group that have been through the trial and error and are now succeeding.
Once you’ve passed the ridicule stage, it doesn’t get any better just yet.
AWKWARD STAGE 2:
You are attacked
This to me is the worst stage.
Because as you’re finding your trading personality and risk profile, other traders get all up in your business.
They tell you how wrong you are. They tell you how you’re not making any money and worse they gang up on you.
I remember in 2009, I was doing ok as a trader. I joined a couple of groups on Skype and Facebook.
And when I were to buy a trade (based on my strategy), the rest of the members attacked me by saying how wrong I was and that I’m going to lose all my money.
And I just felt out of place by being called the contrarian of the group.
I never attacked their analyses, I never tried to bring them down and I never interfered with their trading.
I was then kicked out of many of these groups and was referred to as an emotionless robot.
This once again left me as the loner trader with no community to relate to.
Don’t worry about these people.
Most of them have blown their accounts by now and still don’t know how to trade.
Keep going and just keep trading. You’re doing well and don’t need this negativity.
And then you’ll enter another awkward stage once you’ve progressed as a trader.
AWKWARD STAGE 3:
You are ignored
Yep…
You can make a living as a trader for over a decade. You can be at the maturity phase of your trading.
You can be a multi-millionaire.
But you’re still going to be ignored, by a number of groups.
First, you’ll be ignored by pretty much all of the people who attacked you in the second stage.
Second, you’ll be ignored by the egotistical traders just starting out and think they know better.
Third, you’ll be ignored by nearly ALL of the trading companies that sell the false dream of making millions as a Forex trader.
I’ve learnt that everyone wants you to do well, but not better than them.
And I feel very sad for humanity, who think like this.
I celebrate all traders who mean well, whether they are new to trading without any money saved up or are multi-millionaires. I even celebrate those who are much wealthier than I am...
Because we are all on our own trading journey to success and time.
Don’t worry about others, just focus on you!

Money you can get back as a trader - Time you can't!When you're YOUNG you have time and energy but no money.
when you're an ADULT you have energy and money but no time.
When you're RETIRED and old you have money but less time and little energy.
So, yes you can make mistakes, yes you can learn to trade, and practice for a bit.
But DON'T do the following:
Make BIG financial mistakes - Because that time to recoup it may be too late.
Procrastinate with when to trade and why to trade - every day is an opportunity lost and an opportunity cost. Bite the bullet and do it well and risk aversely.
Jump from winning strategy to winning strategy because of drawdowns. All trading strategies come with drawdowns and trading in the financial markets can be a highly profitable endeavor, but it can also be a time-consuming and stressful one.
If you approach your trading with ONE strategy that suits you with a clear mind, a solid strategy, and a disciplined approach, you can maximize your chances of success.
As I like to say. It is better to have 9 years of experience trading 1 strategy than 1 year of trading experience for 9 systems.
It makes sense in my head.
Let's focus on the power of 1 and your time will be worth the wait for when you achieve your trading success.
Trade well, live free.
Timon
(Financial trader since 2003)

HOW IT WORKS: RSI (Relative Strength Index) IndicatorThe RSI is a popular momentum indicator used in technical analysis. It was originally developed by a mechanical engineer turned technical analyst J. Welles Wilder Jr.
It was first published in a 1978 book, “New Concepts in Technical Trading Systems” and in Commodities Magazine (Futures magazine) in June’s 1978 issue.
Today the RSI is one of the most popular indicators used to measure the speed and change of price movements.
In other words, it measures the strength of its trend direction (up, down and sideways) on any market by monitoring the changes in its closing price.
THE MAKE UP
The RSI is a line graph that moves between two extremes…
On the vertical axis (Y-Axis) the RSI line moves up and down in a range between 0 and 100.
NOTE: As the indicator is between a range, it is considered a closed indicator.
On the horizontal axis (X-Axis), the RSI line moves to the right which is plotted as time.
NOTE: You can choose your own time frame i.e. days, hours, minutes etc…
For all you technical boffins…
If you want to know how the RSI is calculated, I’ve saved this at the end of the article.
As a trader you won’t need to worry about the maths at all.
Three trading signals you’ll use with the RSI
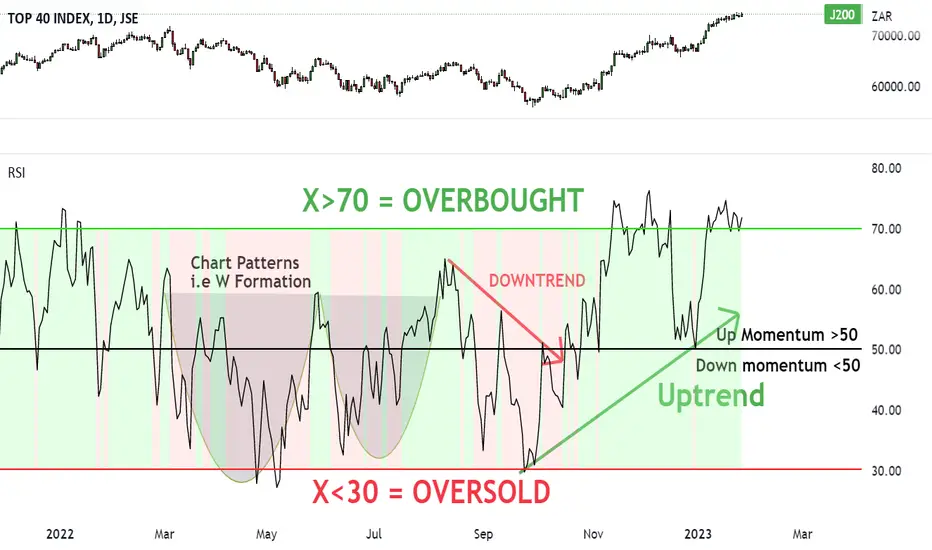
1. Overbought and Oversold levels
2. Patterns and Trend lines
3. Bullish and Bearish Divergences
Trading signal 1:
Overbought and Oversold levels
When we see the market’s price move up, this means the buyers are outweighing the sellers.
And the more higher closing prices we see, on a market, the higher the RSI line moves…
When we see the market’s price drop, this means the sellers outweigh the buyers.
And the more lower closing prices we see, on a given market, the lower the RSI line moves…
However…
If the buying continues at an unsustainable rate, the RSI will reach a point that traders call OVERBOUGHT (top heavy).
This is where we could start to expect the price to drop from these levels and for the market to enter into a correction (dip).
If the selling volume continues at an unsustainable rate, the RSI will reach a point that traders call OVERSOLD (undervalued).
This is where we could start to expect the price to turn up from these levels and for the market to enter into a recovery (upside).
Now that you understand overbought and oversold terms, let’s explain what I mean with the RSI chart.
Overbought RSI: 70 (Sell opportunity)
When you see the RSI line touch or cross above 70 (Red horizontal line), this is considered an overbought situation.
At this point, traders may start to anticipate that the rising trend is about to end.
Traders may then start to prepare to sell and short their positions, as they believe the market’s price has run up too much.
If the market then turns down and starts to drop in price, the RSI line will drop below 70 and head back to equilibrium at 50 (Black horizontal line).
Oversold RSI: 30 (Buy opportunity)
When you see the RSI line touch or cross below 30 (Green horizontal line), this is considered an oversold situation.
At this point, traders may start to anticipate that the falling trend is about to end.
Traders may then start to buy (go long) their positions, as they believe the market’s price has dropped too much.
If the market then turns up from the 30 mark and starts to rise in price, the RSI line will move back to equilibrium at 50 (Black horizontal line).
Trading signal #2:
Trend lines & Patterns
The second way to spot buying and selling trade ideas is with trend lines and patterns.
Uptrend confirmation
To confirm the strength of the market’s uptrend, you should be able to draw a support (floor level) under the high low RSI prices.
And when the RSI breaks below the support line, it could signal the end of the uptrend and a start to the next bear market.
Downtrend confirmation
To confirm the strength of the market’s downtrend, you should be able to draw a resistance (ceiling level) over the lower RSI high prices.
And when the RSI breaks above the resistance line, it could signal the end of the downtrend and a start to the next bull market.
These are great confirmation and reversal trading signals to use with your strategy.
NOTE: You can also base your buy or sell ideas on trading chart patterns…
Trading signal #3:
Bullish & Bearish Divergence
The third signal I use to spot trade opportunities with the RSI is looking at the market’s price VERSUS the RSI’s direction.
In short…
BEARISH DIVERGENCE – Warning for downside
If the markets price makes higher lows, while the RSI makes lower highs – it’s a warning for DOWNSIDE to come.
BULLISH DIVERGENCE – Sign for upside
If the markets price makes lower highs, while the RSI makes higher lows – it’s a signal for UPSIDE to come.
Either way with both bullish and bearish divergences, the RSI fails to accept the current market’s price movements.
And so it is making a probability prediction that soon the market will make a reversal in its current trend.
Ok so now you know how the RSI works. Let’s sum up what we learnt.
RSI Summary in 3 Trading Signs:
Trading signal #1:
Overbought & Oversold levels
Overbought zone X > 70 = Selling opportunity
Neutral zone: X = 50
Oversold zone X < 30 = Buying opportunity
Trading signal #2:
Trend lines & Chart patterns
Uptrend confirmation: RSI makes higher lows (draw support line)
Downtrend confirmation: RSI makes lower highs (draw resistance line)
Breakout confirmation: RSI breaks out of a chart pattern
Trading signal #3:
Bullish & Bearish Divergence
Bullish divergence: Market’s price – lower highs
RSI – higher lows
Bearish divergence: Market’s price – higher lows
RSI – lower highs
Here’s how to calculate the RSI
The most common (default) settings for the RSI is 14 (Which we’ll use))
There is a two-part calculation with the RSI.
Part 1: Calculate the RSI (step 1)
RS or Relative Strength is (Average Gain ÷ Average Loss)
Average Gain = (Sum of gains over the past 14 periods) ÷ 14
Average Goss = (Sum of losses over the past 14 periods) ÷14
Calculate the RSI (Step 1)
Part 2: Calculate the RSI (Step 2)
Once you have this result, we then smoothen the RSI result with part 2…
And so that’s how the RSI continues with each closing price of the time frame you choose.
Trade well, live free.
Timon
(Financial trader since 2003)
5 Signs You’re Doing GREAT As A TraderMoney should not tell you how well or bad you’re doing as a trader.
Percentages should reveal that all.
It’s all RELATIVE.
And so, in this TradingView piece, you’re going to go through a five signs checklist to see how well you’re doing as a trader.
Sign #1:
You have a personal trading strategy
Do you know what:
System you’re going to use to enter and exit your trades?
Markets you’re going to choose? and
Risk management principles you’re going to follow?
And have you found that system that matches your personality and time preferences?
If so… AWESOME! Tick it off the list.
Sign #2:
You’ve developed realistic trading goals
Once you’ve got your trading strategy in a bag, you should have all your goals written down.
Have you jotted down your trading strategy, stats, goals and expectations?
This is your game plan that you’ll need to follow when you trade.
You need to see what kind of outcomes you’re going to have with your trading.
• How many trades will you take per year?
• How many winners can you expect?
• How many losers will you take?
• What is your win rate?
• What % of your portfolio will you expect to achieve?
Sign #3:
You’ve experienced a bad trading patch
I feel this is the initiation side to getting to a higher level as a trader.
When you have the strategy and goals in a bag, you’ve got to then put it all into play.
And during this time, there’ll be once or twice a year a couple of weeks where you’ll go through a bunch of losing trades.
If you have the right money management principles, you should be able to EASILY weather through this time.
The markets move up and down and sideways… And during one of these periods, it will NOT fit well with your system.
But let me tell you this, once you’ve gone through your drawdown period, and the markets become more favourable.
It is the most exhilarating feeling, for your portfolio to make new highs once again.
Go through this my friend, and you’ve ticked off another sign you’re doing GREAT.
Sign #4:
You continue to EVOLVE
Sure, the trading strategy might not change.
The risk management side won’t change.
But there are a few things that will change, that you’ll need to adapt into your trading.
First, markets, stocks and currencies are unlisting and listing ALL the time. And your trading strategy requires a watch list that works best with your system.
So, you have to evolve to dump and add markets into your watch list that complement your trading strategy.
You might also find a technique to increase your win rate and ride your winners up.
If you can evolve as a trader, TICK it off the list.
Sign #5:
You are INDEPENDENT
Do you care about your family, friends, pets and strangers opinions on the trades you take or have taken?
No? GOOD!
Tick it off the list.
Nobody in this world, can tell you what to is right to buy or sell according to the strategy you use.
You have the stats, you have the goals and you have your game plan.
So how did you do?
Trade well, live free...
Timon
(Financial trader since 2003)

JSE Top 40 IndexThis morning I published a note to clients, highlighting 6 factors which suggest an appealing reward-to-risk for sellers.
One of the chart (shown in this note) was highlighted with the following comment: "A 7-week RSI above 80 has often led to retracements, offering an attractive reward-to-risk for sellers."
For more research insights, including trade ideas, get in touch today.

53 Important Trading Acronyms and AbbreviationsHere are 53 trading acronyms and abbreviations to remember and apply to your trading.
I’ve also listed them in alphabetical order to make it easier to spot!
ATH - All Time High
ATM – At the Money
ATR – Average True Range
BB – Bollinger Bands
B/O - Breakout
Be - Bearish
BE - Break even
BOS - Break of Structure
Bu - Bullish
CFD – Contract for Difference
DD – Drawdown
DMA – Direct Market Access
EMA – Exponential Moving Average
E/R - Earnings Report
ETF – Exchange Traded Fund
FA - Fundamental Analysis
FOMC – Federal Open Market Committee
FOK – Fill Or Kill
FX – Foreign Exchange (Forex)
GTC – Good ‘Til Cancelled
HH - Higher High
HL - Higher Low
HOD - High of Day
HFT – High Frequency Trading
HTF - Higher Time Frame
ICO – Initial Coin Offering
IPO – Initial Public Offering
ITM – In the Money
JBTD – Just Buy the Dip
LH - Lower High
LL - Lower Low
LOD - Low of Day
L/S – Long or Short
LTF - Lower Time Frame
MA – Moving Average
MACD – Moving Average Convergence Divergence
MS - Market Structure
OI – Open Interest
O/N - Overnight
OTC – Over the Counter
OTM – Out The Money
NFP - Non Farm Payrolls
P&L – Profit and Loss
PIP – Percentage In Point
PRE - Pre Market
R/R - Risk / Reward
RSI – Relative Strength Index
S/R - Support and Resistance
SL - Stop loss
TA - Technical analysis
TF - Time Frame
TP - Take profit
YTD - Year To Date
Can you think of anymore?
Let me know in the comments.
Trade well, live free.
Timon
(Financial trader since 2003)

Don't lose a part of yourself when taking a lossLosing a part of yourself with a loss is a common experience for many traders.
When you're in a trade it's easy to get caught up with emotions.
When it's going your way, you almost feel like you've banked a winner.
When it's going against you it feels like you're a failure and have lost already.
You got to work on it and stop both feelings from taking over your trading.
There is financial loss but more important emotional loss.
Take the financial loss as a simple cost of running a business.
But NEVER get caught up with the emotional cost of failure.
Rather drop your risk per trade even more, until the point of losing or gaining has no significance to your emotions.
Achieve that and you'll know your risk profile and where you are right now as a trader.
Work on it and it gets easier over time.
Trade well, live free.
Timon
(Financial trader since 2003)

JSE ALSI showing strong upside thanks to China & January EffectJSE has been forming a fantastic Cup & Handle since March 2022.
The price broke up and out of the brim level and I want long and bought it.
7>21 (Bullish)
Price >200SMA (Bullish)
RSI >50 (Green back) Bullish
The first target is 83,209
It seems like despite the economic crisis with load shedding, water outages - The rand has gone up a bit since inflation slowed at 7.2%.
Naspers and Prosus are also helping the JSE head on up with the run up on China since the Covid restrictions.
I guess the January Effect is still strong and we should continue seeing upside to come - touch wood.
Trade well, live free...
Timon

BEFORE and AFTER Each Trading Day you shouldA game-plan is a must, to see a potential goal, dream or vision.
You got to have a proper POA (Plan Of Action) and execute.
Whether it’s selling property, building a business, playing a sport or growing your wealth.
You need a BEFORE plan and AFTER plan.
Same with trading. You need to have a trading plan BEFORE and AFTER each trading day.
BEFORE Each Trading Day:
1. Know the main market’s trend direction
The first thing I want to know is, what the main market’s trend direction is.
Plot the resistance (ceiling) and support (floor) levels, so you know whether they are in an up, down or sideways trend.
If up – look for longs (buys)
If down – look for shorts (sells)
If sideways – look for potential breakout levels.
2. Scan through your watchlist
Once you know the main market’s trend direction, have a quick scan through your watch list (markets you trade).
Orientate yourself with where the markets are heading and whether trades are lining up.
This way, you won’t go into the trading day blindly.
3. Write down high probability trade setups
You know the main market’s trend direction, and have an idea of where the markets are heading – now you can plot your trade ideas.
Go through the watch list again, and write down any potential trade setups (with your written entry, stop loss, take profit and reasons for entering the trade).
4. Choose your TRADES for the day
Just because you have written down trade setups, doesn’t mean you need to take every one of them.
Instead, look at which ones which will yield a better probability at working out and has a better chance at winning.
All done before the trading day has even begun…
AFTER Each Trading Day
1. Journal every trade
When the markets’ have closed, and you have time to breathe, go to your trading journal and jot down the trade/s you took for the day.
Each entry should have the (Market name, date, type, margin, entry, stop loss, take profit and reason for entry).
2. Outline lessons of the day
If you’re just starting out or you’ve been in the markets for less than five years, I suggest this extremely useful step.
Write down any market lessons you learn for the day.
Here are some lessons you can write down:
How the market reacted to a news event
How you felt taking a trade or holding onto current trades
Mistakes of the day you learnt or made
Trading lessons that you want to incorporate into your trading…
Write these lessons down, as they will forever be part of your experiences to become a successful trader.
3. Re-check & confirm your open trades
This is extremely NB*.
Make sure your entry, stop loss and take profit levels are still in the trading platform with all open trades, at the end of the day…
Sometimes, brokers have certain glitches in their systems, that can remove your trading levels (automatically).
It happens on a continuous basis and it’s our job, to make sure everything is running smoothly and our levels are still in place.
4. Quick scan your watch list & look for potential trades for tomorrow
Last action you can take for the day, is preparing for tomorrow.
Go through your watch list, look for the next batch of trade setups and write them down. This is so you know what to do for the next day…
Trade well, live free.
Timon

ALSI - Hourly resistance zoneThe JSE ALLSHARE is now back at an ALL TIME HIGH and key resistance level on the hourly .

JSE Top 40 Index: Chart #2“It also appears to be a call on the US Dollar/Chinese Yuan to a certain degree with the optimism around China. See the J200 vs USDCNY (Inverse) chart below).”
Related chart, published earlier attached.

JSE Top 40 Index Comment on request. My response below...
"On all metrics it look like one of the most overbought conditions (per the daily chart) in a decade. The usual stats apply (price at 2x mean, divergence etc), but what I've also noticed is the distance vs the 200-day SMA. The index is +15% above the SMA - the 2nd highest in a decade."

Why the INNOCENT traders always get scammedI received a very important question from a dear member named Bakang. He asked
"Why do people who show the most dedication are the ones who gets scammed most of the time".
Now, I have given an indepth answer with certain reasons and a book I wrote, because of how important this topic is...
Please read it and share it to your friends, family and groups. You just might be helping them avoid being scammed themselves.
Here is my answer:
Thank you for your question and it is a very common problem in society.
There are many reasons why innocent people tend to fall for scams when it comes to the stock market and other high promising schemes.
Reason #1: Humans are just too trusting
Humans have a tendency of trusting the fellow man and believing in the greater good of them. They read about how they’ll make fortunes with them using secretive and insider information – and they make you feel a part of something.
Then as soon as they have your money, they leave you and head over to the next victim like a snake in the grass.
Reason #2: Hot next thing
Every scammer tries to outwit another scammer’s intention. They see what one scammer is offering and they make even more false promises, lies and tendencies.
Then the innocent person is lured in because they don’t want to MISS this ‘once in a life time opportunity’. This has been happening for thousands of years, and human nature is unlikely to change.
Reason #3: Being persuaded by top marketers
The biggest type of scammer is the loudest, most charismatic and they show off things that they don’t have. Or the money they do have it’s from the people who have been scammed.
This is where you read the loudest promos, false and misleading information and advertising.
Also, my favourite is where people read FAKE testimonials with life stories on how something changed their lives…
Reason #4: Fear, Greed and Ego
Most people who are scammed fall for the two big sins of life. Fear and Greed. They fear to miss out on these opportunities and fear that it will never come again.
They have greed where once they’re lured in, they believe in it and deposit a lot more money having this undeniable faith they will be rewarded.
EGO is the one that is hardly spoken about but I think it’s equal to fear and greed.
Ego is where they refuse to believe it’s a scam. They believe they made the right choice joining them and where they want to prove to everyone, he/she was right and they were wrong.
Reason #5: Lack of education
The first way people are scammed is when they don’t have the starting education and understanding of the true and real principles that come with the venture they’re in. They think, because they have money they will win.
But when you dig into the actual principles and education, you’ll realise that there is and has never been a get rich quick way into anything. Everything requires risk and probabilities to achieve some kind of reward in the medium to long term.
Other reasons!
There are other reasons like feeling desperate to do something, acting urgently without thought, being persuaded by others and believe wrong and false information on a website.
It is up to you and me and all of us to better educate ourselves, avoid any scams and to choose the right people to trust and learn from…
Hope this helps and feel free to share this to spread awareness to fellow traders.
Trade well, live free.
Timon
MATI Trader (Trader since 2003)

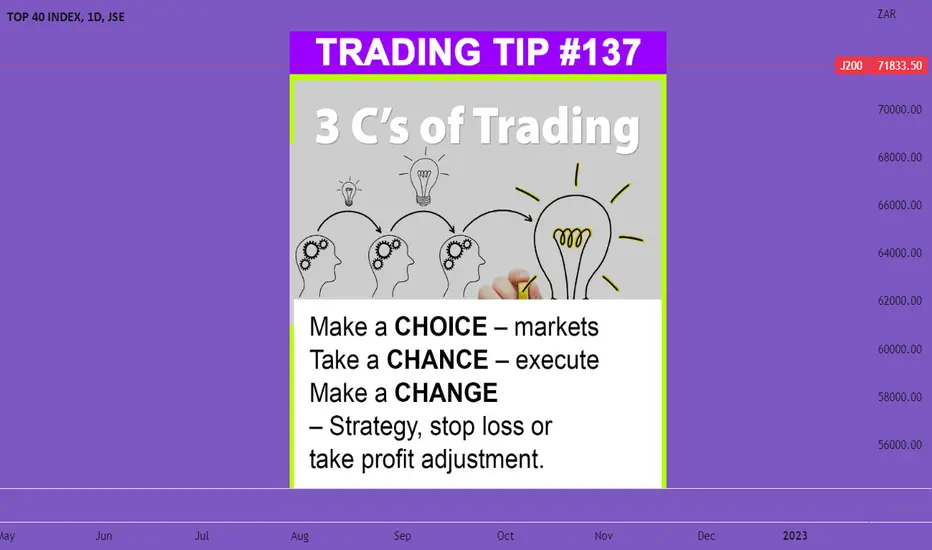
3Cs of trading - Must readI call it the
3 Cs of trading
Trading the financial markets can be a challenging and rewarding endeavor.
One of the keys to success in trading is making informed...
Choices - Choose the markets you want to trade, the strategy, the time frame, choose your mentor and choose your times and plans...
Next you need to take calculated:
Chances - Take a chance to execute, to deposit money in your account, to set up your trades and lineups.
And then be willing to adapt and make.
Changes - Changes to your strategy, journal, system and whatever you need to evolve with the current market conditions and environments.
Did you find this helpful? I'd love to hear your feedback
Trade well, live free.
Timon
MATI Trader
How To Handle And Minimise Your Losses in A DrawdownI want to cover different ways to handle yourself during a drawdown to minimise your losses.
Minimise Drawdown Part #1:
Lower your risk per trade
There are times when the market will be in a bad market environment…
This is when no matter whether you buy or sell, you end up just taking a whole bunch of losses.
The first trick is to pinpoint when the market is in a bad environment.
For me as a breakout trader, I wait for the main index to move in a sideways trend.
This way, I know I have a medium to low probability of the trades to work out.
If you can find out when the market is in a bad environment, then you’ll know when to lower your risk.
In my case, I drop the risk from 2% per trade – down to 1.5%.
If my portfolio continues to drop, I will lower the risk further to 1% per trade until the market rectifies itself.
This is the first way to minimize your losses.
Minimise Drawdown Part #2:
Lower the number of trades you take
You’ll know when the markets are looking S#@t all around.
This is because the large stock markets tend to lead the emerging markets.
And when this happens, the second best thing you can do is limit the trades you take.
If you find you’re averaging around five to nine open trades at a time, it might be time to start cutting down.
Because what if all nine trades end up to be losers, due to the bad market environment?
Well you’ll find yourself down around 18% of your portfolio.
So instead, limit the number of trades you’ll hold during the drawdown phase. Maybe it will four to five instead…
Just remember that being neutral and holding cash is ALSO a trading position.
Minimise Drawdown Part #3:
Hedge your positions
This doesn’t always work, but it has saved my ass a couple of times.
When I find I’m long (bought) five stocks.
And I see that the market has completely changed direction to the downside. I know that there is a higher chance that I’m going to get stopped out.
So to limit my risk, I’ll immediately look at stocks that I can trade short (sell).
For example, I am currently long four stocks. And all four stocks are in a the negative. So, in the last two weeks I’ve decided to short three resource stocks (as a hedge).
This way, I’m now down only 3% of my portfolio rather than 5% since the drawdown…
Minimise Drawdown Part #4:
Other ways
The other powerful way to control your drawdown is to lock in profits when the trades are going your way. You can think of it as a trailing stop loss.
I personally often raise my stop loss when the market moves where the risk to reward is 1:1…
This way I know I’ll lock in a gain, should the market turn against me.
There are many ways you can adjust your stop loss including:
• Trail the stop loss as the price moves further away from the trending Moving Average
• Trail the stop loss after the market’s price moves a certain percentage
• Trail the stop loss when you see volume starting to drop
• Trail the stop loss when an indicator is oversold or overbought
• Trail the stop loss after the market’s price moves to a certain risk to reward
FINAL WORDS
Drawdowns are inevitable. And you need to know how to manage your Drawdowns…
You now have some ideas on how to handle your drawdowns better.
Trade well, live free.
Timon
MATI Trader (Financial trader since 2003)
Feel free to follow my socials below. I love writing about trading and sharing my 2 decade experiences.

How Much to Recover After a Trading DrawdownA Drawdown is a drop in a portfolio value after one or more trades. It’s when the portfolio dips from the highest high.
Once you’ve entered into the inevitable drawdown phase, you’ll need to know how much you’ll need to recover.
That’s where the drawdown calculation comes in…
The Drawdown Formula to recover after a portfolio drop
Let’s use three examples of traders with drawdowns.
Example #1: Timon is down 5% of his portfolio in the last three months.
Example #2: Alex is down 50% of her portfolio in the last three months.
Example#3: Artemis is down 76% of their portfolio in the last three months.
Next we’ll need the Drawdown Formula
Required gain = -1
Let’s put in three drawdown percentages to see what we need to recover to get our portfolios back to what they were…
EXAMPLE #1: Timon’s drawdown = 5%
Required Gain = – 1
= – 1
= 5.26%
EXAMPLE #2: Alex’s drawdown = 50%
Required Gain = – 1
= – 1
= 100%
EXAMPLE #3: Artemis’s drawdown = 76%
Required Gain = – 1
= – 1
= 316%
In the above examples, I need to recover 5.26% of my portfolio to get it back to its highest level.
While Alex and Artemis needs over 100% and 316% to return their portfolios to what they were.
Now you know how to calculate what you need to recover after a trading drawdown.
FINAL WORDS
Do you now get that you need to take your drawdowns more seriously?
With any business or venture, you should always be wary when you enter into a tough time.
In fact, you should never be down more than 20% on your trading portfolio, business or in any other financial venture…
Once you start going below 20%, it will take a heck of a lot longer to get back to what it was…
That’s why this article is only part one…
Trade well, live free.
Timon
MATI Trader (Est. 2003)
Feel free to follow our socials below.
Success is a self-introspection journey!You and I both know that financial trading the markets is an exciting and most definitely a lucrative venture for those who actually take the time and energy to get it right and trade well.
But!
Big But...
If you want to become a successful trader, it's not just about analyzing market trends and making informed decisions – it is also about self-introspection and personal growth.
This journey is one big self-discovery. And you'll find it's not only beneficial to trading but with life, love, work and even your true identity.
Aas traders must know our own motivations, behaviors, and beliefs in order to truly excel.
This means taking an honest look at our strengths and weaknesses, and being willing to make the necessary changes to become a more disciplined and effective trader.
Do this and you WILL develop a strong sense of self-awareness in order to make better decisions under pressure.
Trade well, live free. I'm off to bed.
Timon
MATI Trader (Financial trader since 2003)

6 Thinking Hats for a TraderIf you don’t know the 6 Thinking Hats by now, I have to ask.
How do you solve problems, deal with arguments or make decisions?
I do forgive you though, as these strategies are not ones we learn in school.
In fact, when I first read about this strategy, I got to say every aspect of my life changed (including trading).
I hope this article will change your life too.
Let’s start with the main man himself.
The Author of The Six Thinking Hats
Edward de Bono is a world-renown lateral thinker, writer and philosopher.
In fact, he was the first person to use the term ‘Lateral Thinking’.
Born in 1933, in Malta, Edward has achieved a number of degrees and has published over 85 books (mostly on thinking and the use of language).
But out of all his works of art, there is one of the most popular techniques that changed the world and changed the way we think.
It’s called The Six Thinking Hats or 6TH.
Here’s how it works
There are six different imaginary hats, with each having a different colour.
Each time you put on a hat, you change the way you think about something. It also helps you see with better clarity and with a different perspective.
Whether you’re having an argument, making a decision, solving a problem, building a business or creating a trading strategy – the 6 Thinking Hats will help streamline the process.
If you’re with more people, make sure everyone is wearing the same hat at a time, to avoid conflict.
Let’s now get into the inner workings of the 6 Thinking Hats, and how it can apply to your trading and other aspects in life.
HAT #1: WHITE
NEUTRAL VIEW
This is the hat that contains all of the information, facts, data, figures, metrics and statistics.
When it comes to trading there are certain facts that you need to have considered including:
The broker you choose
The affordability
The costs involved
What equipment you have to trade
Back testing, forward testing and real testing data and statistics with your strategy.
HAT #2: RED
EMOTIONAL VIEW
The second hat you’ll put on is the RED HAT.
When you put this hat on, come to terms with what you feel.
I’m talking about your intuition, your fear, your greed and your gut feeling.
Then when it comes to trading ask yourself these questions…
· Can you handle risking money you have?
· Do you feel you have the discipline to pursue trading on a weekly basis?
· Do you enjoy the idea of trading?
· How much money do you think you can easily deposit into your trading account?
· How much money do you think you can psychologically handle losing, if you take 10 losing trades in a row?
· Do you think you can sleep easily at night knowing you have your money tied up in the markets?
Once you go through all the feelings and you answer the questions, then you can move to the third hat.
HAT #3: YELLOW
POSITIVE VIEW
This is the hat you’ll find is the one, you want to leave on when you think.
It’s the hat that contains all the benefits and rewards.
When you put this hat, you’ll think of the following with trading:
What are the benefits to trade?
How much money do you want to make a year trading?
Why will your trading strategy work?
What are your goals as a trader?
Why is trading the best decision for your financial future?
Feeling good? Well you’re supposed to when you put on the yellow hat.
But we still have three more hats to go…
HAT #4: GREEN
CREATIVE VIEW
With every decision comes extra out of the box thinking. And that’s where the green hat comes in.
When you put on the green hat, this is where your imagination should help you with brainstorming, new ideas and add-ons to the think tank process.
With trading, there are just so many different ways to be creative. And you’ll find that with ever evolving markets, you’ll need to adapt and adjust course.
Here are some ideas to think of when you put on the green hat.
How can I let my winners run further systematically?
How can I increase my win/rate i.e. Trailing stop loss
What indicator can I use for peripheral vision to help with my confirmation on each trade?
I should create and print a few psychology sticky notes to help with my trading.
I should name my system to be more personal with it
I should find ways to tweak my system which will help with the performance
I should have a trading consultation with Timon to help build and optimise my trading strategy better J.
HAT #5: BLUE HAT
PROCESS VIEW
When you put on the blue hat you should think of three main things…
Systems, criteria and planning.
This is where you’ll choose the criteria you’ll follow with your trading strategy.
What indicators are you using?
What parameter’s are you using with the indicators?
What time frame works best?
What calculators do you need whenever you trade?
This is where you’ll find the main work takes place once all the planning is done…
And one where you’ll eventually marry a strategy to help grow your portfolio.
HAT #6: BLACK HAT
NEGATIVE VIEW
When you put on the black hat, four things should arise instantly.
Difficulties, problems, weaknesses and risks…
I saved this hat for last, because it’s the only hat that will most likely help you decide whether trading is for you or not.
But you can re-arrange the hats according to your won preference.
The main things to ask when you put on the black hat, with trading is:
What are the dangers of trading, risks, financial risks and time risks?
What if the system stops working?
Why are you sceptical about trading?
What if the current markets go into an unfavourable territory?
What if the market drops to zero when I’m in a long trade?
FINAL WORDS:
How awesome!
You now have The Six Thinking Hats to your every decision making process.
You’ll find that it will force you out of the mono-lateral way of thinking which you’ve habitually had your entire life.
You’ll see things with new perspectives and compartmentalize issues in new ways…
It might even pro-long your marriage or improve your relationships…
If you enjoyed this article, I would love to hear your thoughts
Trade well, live free.
Timon
MATI TRader (Established 2003)

LEAVE ME ALONE! LEAVE ME ALONE!
Once you have entered a trade and set your trade levels (such as stop-loss and take-profit), LEAVE IT ALONE.
It is important to let the market play out and not interfere with the trade.
This way you'll follow your trading plan and not be swayed by emotions or external factors.
Also, if you leave it alone it will also stop you from taking impulsive decisions in the future, which can be super dangerous in the long term.
Once you've done your bit and left the trade to do its thing, once it hits your stop loss or take profit - you'll be able to track, record, evaluate and monitor your trading results.
This cuts out the subjective feelings, emotions and opinions.
It's the play of patience that will help you to learn how to trade well for your financial future.

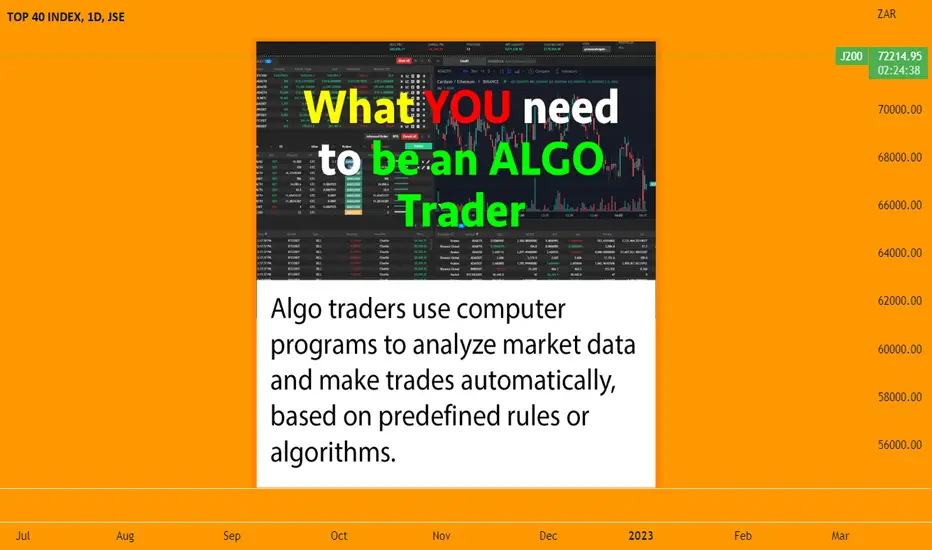
Do you know what it takes to be an Algo Trader?To be an algo trader, you typically need to have a strong background in computer science and programming, as well as a good understanding of financial markets and trading strategies.
Here are some of the important elements you need to be a top Alog Trader:
Experience with database management and data analysis
Knowledge of statistical analysis and machine learning techniques
Understanding of financial markets and trading strategies
Strong analytical and problem-solving skills
Attention to detail and ability to work under pressure
Overall, to be algo trader requires a combination of technical expertise, financial knowledge, and strong analytical and problem-solving skills.
It can be as simple as having an easy and proven mechanical strategy that you can demo, back test, forward test, analyse, monitor and evaluate your results.
This way, you'll have a decent idea on what your system and strategy potentially could yield in the near future.
Trade well, live free.
MATI Trader
Feel free to follow our socials below if you enjoy this content :) Thank you.

JSE Top 40 IndexJSE Top 40 Index - Approaching Overbought/Extended To The Upside AROUND These Levels?
Ultra short term - trading 2x std deviation over 20 days (see smaller internal channel)
Also, trading 2x std deviation over 200 days (see larger expanded channel)
Also note the price extension vs the 200-day simple moving average. It cannot get too far without 'snapping back'. In addition, the 200-day SMA is FLAT - thus making a reversal more likely.
FOMC minutes showed the FED won't be in a hurry to cut... and yesterday's data showed the labour market remains in good shape. Now we await the December payrolls report, due in 2hrs.
