Long Top5 oversold/overbought according to RSI & $JSEKIOEnd of week 5Apr19. When last did we see #Coronation in top overbought list? FTSE/JSE Allshare Top5 oversold/overbought according to 14day RSI indicator as follow:
Fortress B 22
Omnia 23
MIX Tel 25
Nampak 27
Afrox 28
Alex Forbes 77
Naspers 74
Coronation 73
Kumba 71
African Rainbow Min 69
Spending a bit of time on Kumba. Nice recovery that started in January 2016, which saw the company move from R24 to the R450 recent levels (yep, that is close to 1800% in 3 years). The share however find itself at heavily “overbought” levels now, with a possible pullback that could be aggressive if found on the wrong side.
If I was long in $JSEKIO, I would set my stop-loss at the 0.786 Fibonacci retracement support level at R418. A break through these levels could see the share most probably try and test the 50-day moving average at R376.40.
According to Thomson Reuters consensus forecasts, analysts got a SELL on the company and see possible downside of -34% in the share price (expected one year forward) – Target price of R292.78, which is also more or less at the current 200-day moving average.
KIO trade ideas

KIO showing another bearish setup $JSEKIOKumba has been trading below it's 200 day moving average for the last 4 months and we have noticed most of the shorter term moving averages trending down and trading below this 200 day. This is evidence of a bearish trend and should see the stock move lower over time. We have recently tested the 200 day ma @ 286 and seen a quick rejection in price. We are trading in a bearish channel and will be looking for a close below the R275 support level to confirm the break down. Also interesting to note is that the Stochastic indicator is showing bearish divergence with the indicator having made a lower high, even though price made a higher high on the daily. Target of this move should then be R235.

$JSEKIO Kumba iron ore - has this rally gone too far too soon?Haven't called this stock too well this year, however after the magnificent rally we have seen of late, the stock may have gone too far too soon. Firstly if you look at purely the candlestick formation after today's trade, we are possibly witnessing the formation of an evening star reversal formation (tbc tomorrow). Secondly, we are starting to see volume evaporate on the move higher which is a possible clue that buyers are no longer interested in chasing price at such levels. Thirdly, we are starting to see some bearish divergence on the RSI (price has made higher high, not confirmed by a lower high in the RSI indicator). Watch for a possible reversal here. Price very very extended from major moving averages, so consolidation/correction very likely from here.. Would hope to see at least R400 on a shorter term pull back

JSE:KIO Kumba Being DistributedThe resources sector has been strong but Kumba has been a laggard in the sector. The Trading Range (TR) that was formed seems to have the characteristics of distribution with increased volatility. The volatility to the downside is seen by increased spreads, gaps and increase volume. Pullbacks have been on lower volume. After the recent pullback, Kumba is ready to be marked down out of the TR.


KIO- KUMBA IRON
- looking bearish to me not much fundamentals looking to push it really high so i would remain bearish on this

Kumba Iron OreBullish engulfing candle on Kumba yesterday (07 Feb); up more than 2% so far today.
#Observation

Kumba trading at bottom of channelAfter creating a high of R414.90, Kumba turned bearish between January and April of last year reaching a low of R259.21. From there the stock has been trading flat, sticking predominantly to a range with a top at R325 and bottom at R260.
Kumba recently looked to break below support but it turned out to be a false break and price quickly re-entered the range.
With the stock currently trading at the lower end of the channel, I will definitely be going long with the aim to exit the trade when it nears the top.
Action: Place a Limit order to BUY at R273.00 with a Stop Loss set at R253.00. I will aim to take profit at R295.00 and R325.00 respectively.
Margin: 20%
Gearing: 5.00x
Gain: +95.24%
Risk: -36.63%

Waiting For The Pull Back To Get LongKumba Iron Ore is a South African iron ore mining company and a subsidiary of Anglo American. The company is the largest iron ore producer in Africa and the fourth largest in the world. Kumba is a mining group of companies focusing on the exploration, extraction, beneficiation, marketing and sale and shipping of iron ore. Kumba produces iron ore in South Africa at Sishen and Kolomela mines in the Northern Cape province.
Technicals
I am expecting a pull back to form a larger corrective structure as indicated in blue. Once wave 3 breaks the low of wave 1, I will be looking for reversal signs in order to trade the long.


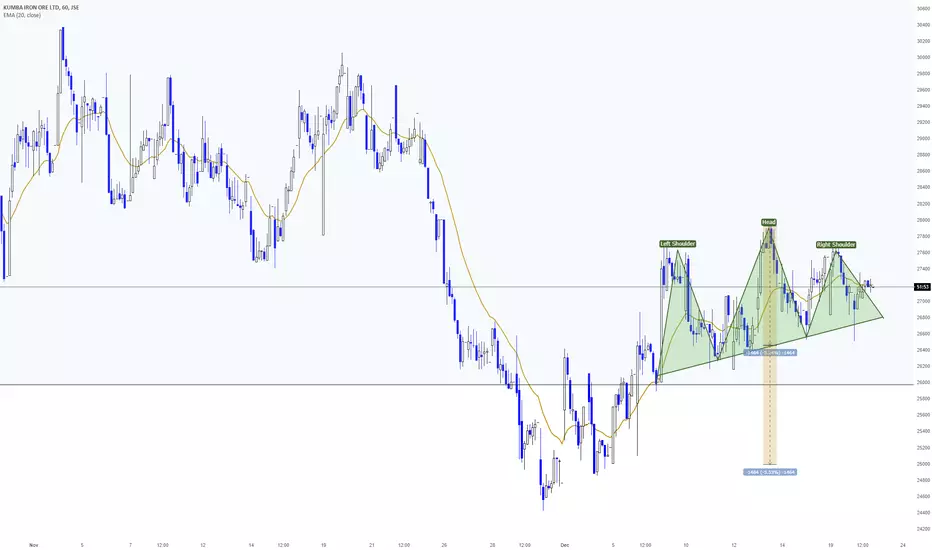
$JSEKIOJSE:KIO
Hourly chart making head and shoulders. If neckline is taken will probably test recent lows.
This is more for short term traders.
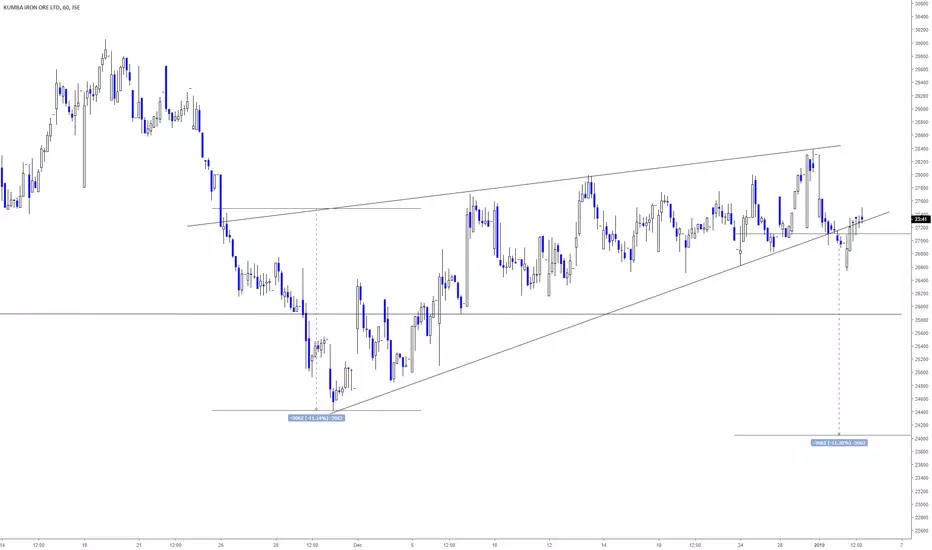
$JSEKIOJSE:KIO
Broke bellow big consolidation area, backtest yesterday and today and looks like now continuation towards target around 19500/20000 area

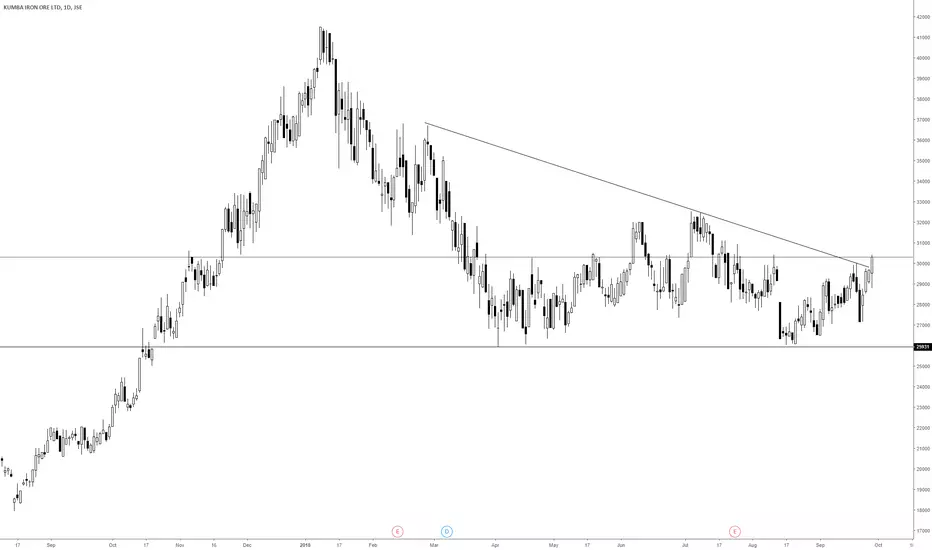
$JSEKIO Breaking down from the channelKumba Iron Ore Has been trading within the bounds of this channel for the most part of 2018. A daily close below the R260.00 support level, could see us move to a projected target of R198-R200. One would suspect many stale bulls holding above R260 and this break could see similar action as we saw on $JSEAPN Aspen when it broken down from its longer term channel base @ R240.00

%JSEKIOJSE:KIO
Didn't manage to break higher,pulled back towards mid of the range. Making small bearish flag currently. Will probably go and test bottom of the range.

KUMBA IRON SHORTKumba's horizontal resistance coincides very closely with the 200 day moving average. Having broken below this moving average, it signals a sell on the stock. We are currently seeing a bounce to re-test that level as well as resistance...I'll be looking to short R314.00 for a downside target of R270.00. Risking only 2% of my portfolio, the stop loss is placed at R327.00 which could signal a possible breakout

$JSEKIOJSE:KIO
It made flat bottom triangle similar one that we had in MTN and APN recently.
If you are bearish on it yesterday's candle is very bearish. Aggressive short with stop loss above yesterday's HOD.

Kumba trading back up in the channelWith Asia trading higher this morning, KIO is holding up okayish but we could very well see the stock trade higher to close that "dividend gap". I also think there is a good probability that the price could make an attempt at the upper band of the more medium term sideways channel. I almost want to say the next "dip" can be bought...
