LONG IDEA ON $MURHave an idea to add to a long position here or buy MUR. Looking for a breakout above this flag setup or the 1400 level, with a close >=1405. Will set a buy limit above 1410 level if price action confirms. The LT trend is down. As always manage your risk.
MUR trade ideas

Murray & Roberts JSEThe share price of Murray and Roberts is prone to growth over the long term into the year 2022

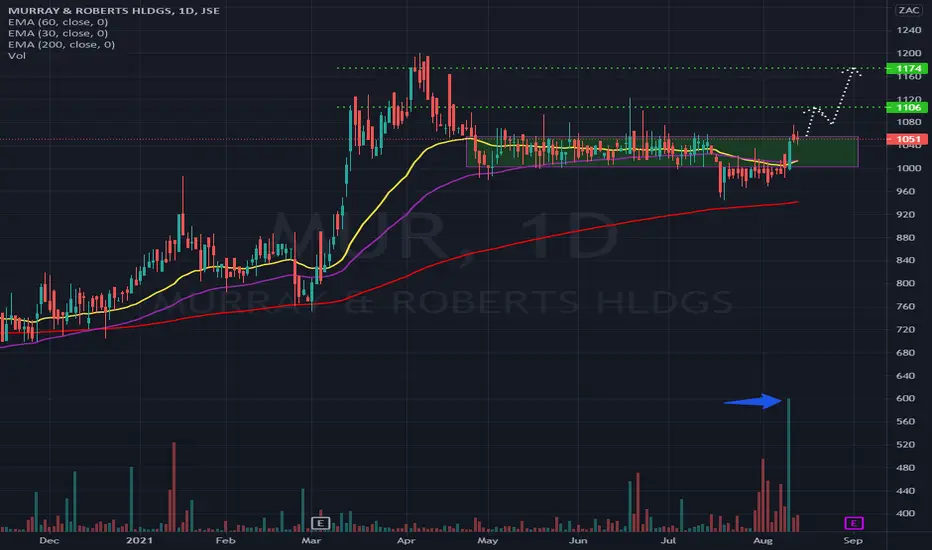
Long idea on MURMUR poised to breakout of this rectangle with unusually high volume transaction in recent days. Short term target 11bucks with 1176 being a longer term target if you taking profits. Manage your risk as the long term trend is still down.

MUR - spike in volumes signal possible move upwardsMTN has been consolidating for a while now and this sudden spike could signal the start of a rise in the share price.

MUR rangeMUR still trading in a range. My preference is to buy weakness to R10 and then sell into strength around R10.50 - R10.70.
Trade ideas are my own and not financial advice.

MUR Bull flag - WeeklyMurray & Roberts did some decent volume last week.
*Breaking out of a Bull Flag & bouncing of support at 700
*Consolidating above the 30 week EMA supports the Bullish trend
*Potential targets are 900 and 1000 can even squeeze to 1200
Disclaimer: This is my personal view and opinion and should not be taken as trading advice...


Murray Roberts reversing?Murray Roberts closed above previous resistance and RSI crossing the 30 scale upwards indicating a possible reversal. The hammer type candle (25 May), indicates after a strong opening above resistance with sellers trying to push the price back down but strong buying pushed the price through key resistance to close 16.53% higher for the day (short wick above with long wick at bottom). Traders should first confirm that strong buying is maintained in next sessions before considering a long position. Should this be confirmed with strong support at 437, possible next targets 488 and 561.
Disclaimer: My analysis should not be construed as financial advise. Share trading is risky and unpredictable at best. I'm just sharing what I see.

JSE:MUR Murray and Roberts High Volume DemandMurray and Roberts has been in a long trend with redistribution stepping stones. However, the resent trading range is showing Signs of Strength (SOS). There have been high volume, wide spread green bars showing demand for the stock. Price has broken out of the trading range and backup to test the trading range again. The stock now looks ready to start the markup in Phase E of the Wyckoff phases. The point and figure chart indicates a count well into the previous range and even testing the upper resistance line of the previous range.
