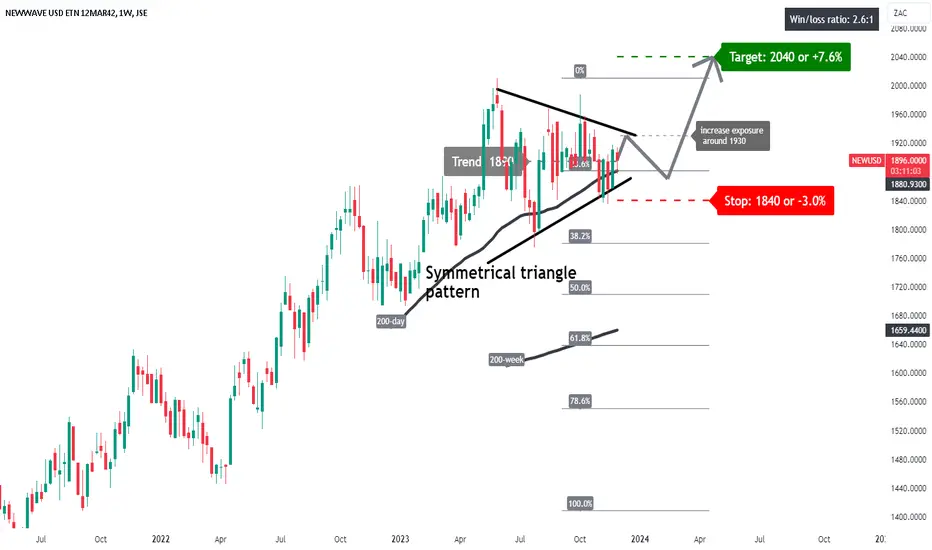
NEWUSD: symmetrical triangle patternA price action above 1890 supports a bullish trend direction.
Increase long exposure for a break above 1930.
The target price is set at 2040.
The stop-loss price is set at 1840.
It remains just above its 200-day simple moving average, which might act as major support.
A symmetrical triangle pattern
NEWUSD: Might the double bottom pattern reach its target?A price action above 1830 supports a bullish trend direction.
Increase long exposure for a break above 1850.
The target price is set at 1880.
The stop-loss price is set at 1800.
The ETN give investors exposure to the US dollar.
Might the double bottom pattern reach its target?

See all ideas
Summarizing what the indicators are suggesting.
Oscillators
Neutral
SellBuy
Strong sellStrong buy
Strong sellSellNeutralBuyStrong buy
Oscillators
Neutral
SellBuy
Strong sellStrong buy
Strong sellSellNeutralBuyStrong buy
Summary
Neutral
SellBuy
Strong sellStrong buy
Strong sellSellNeutralBuyStrong buy
Summary
Neutral
SellBuy
Strong sellStrong buy
Strong sellSellNeutralBuyStrong buy
Summary
Neutral
SellBuy
Strong sellStrong buy
Strong sellSellNeutralBuyStrong buy
Moving Averages
Neutral
SellBuy
Strong sellStrong buy
Strong sellSellNeutralBuyStrong buy
Moving Averages
Neutral
SellBuy
Strong sellStrong buy
Strong sellSellNeutralBuyStrong buy
Displays a symbol's price movements over previous years to identify recurring trends.
Related funds
Frequently Asked Questions
An exchange-traded fund (ETF) is a collection of assets (stocks, bonds, commodities, etc.) that track an underlying index and can be bought on an exchange like individual stocks.
NEWUSD trades at 1,811 ZAC today, its price has risen 0.28% in the past 24 hours. Track more dynamics on NEWUSD price chart.
Since ETFs work like an individual stock, they can be bought and sold on exchanges (e.g. NASDAQ, NYSE, EURONEXT). As it happens with stocks, you need to select a brokerage to access trading. Explore our list of available brokers to find the one to help execute your strategies. Don't forget to do your research before getting to trading. Explore ETFs metrics in our ETF screener to find a reliable opportunity.
In some ways, ETFs are safe investments, but in a broader sense, they're not safer than any other asset, so it's crucial to analyze a fund before investing. But if your research gives a vague answer, you can always refer to technical analysis.
Today, NEWUSD technical analysis shows the sell rating and its 1-week rating is sell. Since market conditions are prone to changes, it's worth looking a bit further into the future — according to the 1-month rating NEWUSD shows the sell signal. See more of NEWUSD technicals for a more comprehensive analysis.
Today, NEWUSD technical analysis shows the sell rating and its 1-week rating is sell. Since market conditions are prone to changes, it's worth looking a bit further into the future — according to the 1-month rating NEWUSD shows the sell signal. See more of NEWUSD technicals for a more comprehensive analysis.
No, NEWUSD doesn't pay dividends to its holders.