NPN SHORT - After retest of prior support / Right shoulder- Sharp drop from 50 EMA , expect re-test this week +.
- 20/ 50 both down ward sloping, suggests better selling at back test area, suggest waiting for confluence of tape.
-Target - first target would be near R2300 , with bigger picture back to R2075 JSE:NPN
NPN trade ideas

Tumultous March for Naspers!!Since November 2017 Naspers just can not close above 247900 on the monthly. Someone is defending that area and we tried again to go through that zone in February and again we couldn't close above.In fact February's close almost ticks all the boxes for dark cloud cover and that is good confluence for my bearish outlook. So March will likely be the start of a bearish run. My ultimate target is around 200000 area,just slightly above that...the interim target being around 220000.
The entry here will be on the daily. Il wait for pullback into my yellow zone and get my trades in as per attached chart.I might change the actual entries and stop losses depending on how it trades out.

NASPERSOn the Monthly chart for Naspers, here is what I see, we had a bullish reversal pinbar which shows that buyers did take the market up to the 278447 level on 2017 but for the past two years it hasnt been able to get back to that level, meaning the sellers were also trying to gain momentum in that period. Now my prediction is that the buyers are going to be still a little dominant but its for a short period, maybe in the next two months but after that we looking at a more stronger short position. I believe that leg "A" should be equal to leg "C" thus the set target which is almost complete. The drop there should drop us down all the way to the 50.00 or 61.8 Fb zone. Lastly, we also have the RSI Divergence confirming, now we just need to lookout on smaller timeframes for better risk management.

NASPERSLooking for the next high to be a lower high than the previous significant high, then we drop as it shows more strength on sellers

Possible reversal on NPNJSE:NPN is trading at quite a strong resistance level at the moment. If it fails to break higher, the chances are good for a downward move. The stochastic seems to be confirming the trend reversal.
As always, I will wait for confirmation before entering.


Take Profit.......BUT.....We got our targeted profit but it turned out to be more than just retracement and hence we left money on the table. . .

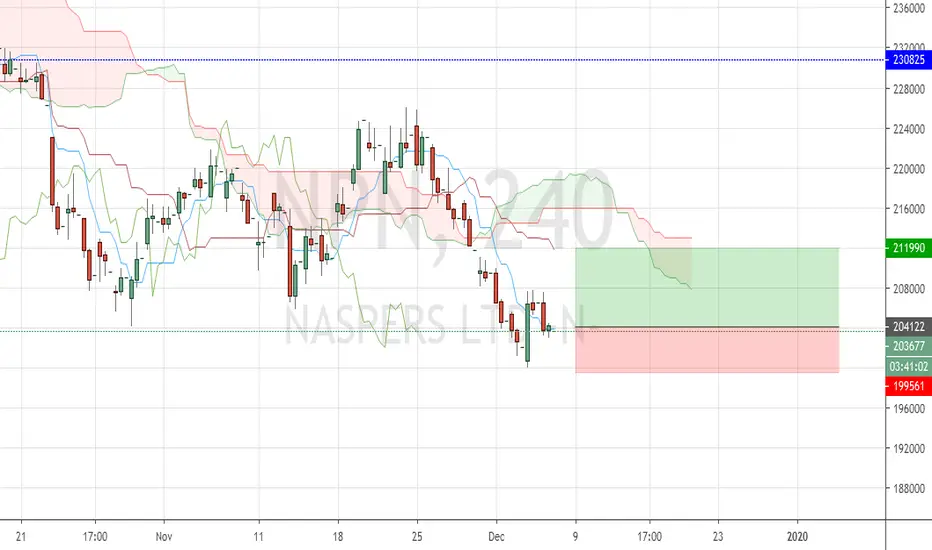
Bullish retracement?!After and almost parabolic drop since 25 November we are seeing the 1st signs of recovery,or rather retracement. Yesterday's engulfing candle indicated that bearish momentum has temporarily stopped. All things being equal we should see a retracement to the 212000 zone.
Entry: 204122
SL: 199561 ( Slightly below the lowest point)
TP: 211990 ( Slightly below the upper price magnet)
NPN - Bullish EngulfingJSE:NPN has a bullish engulfing candle at a support level which could indicate a turn upwards. The stochastic is also confirming so we could be looking at a long position.


Nasper Monthly Chart Equities | Naspers (Monthly): Once again taking a look at the monthly chart, it’s important to be reminded of the long term chart setup. The trend line support going back to the lows of 2003 has been breached with the price developing a double top formation.

Naspers Bear Flag Technical Formation Equities | Naspers (Daily): We identify a ‘death cross’ on the share – this is where the 50-day MA crosses below the 200-day moving average. Also, a technical bear ‘flag’ has triggered, suggesting further weakness for the counter.


Top5 oversold/overbought according to RSI & NaspersTop 5 Oversold & Overbought currently according to their 14-day RSI’s:
Oversold:
Ascendis Health 24
Prosus 28
Telkom 29
Sun International 30
Nampak 32
Overbought:
Capitec Bank 74
Momentum Metropolitan 74
MediClinic 73
Stor-Age Property 72
Aspen 71
This week I want to spend some time on Naspers, as data on Prosus is still a bit thin. Both the companies find itself heavily oversold according to it’s 14-day RSI’s. In Naspers’s case, price went below 30’s RSI, three times before since 30 October 2018. If history was anything to go by, this would generally be the time to buy Naspers (or Prosus).
After the Prosus unbundling announcement was made in March this, first Naspers and then Naspers and Prosus (added) together initially outperformed Tencent (all entities in USD). We however saw a reversal of this movement over the past few weeks, with Tencent now moving ahead of the Prosus/Naspers combined pricing. This indicate that there might again be an opportunity for value seekers to buy into the bigger discount to SOTP.
We’ve also seen that Naspers has developed a strong support level round the R2050 levels, which was tested 3 times before since March this year. Should this support level again holdup, could see the price test R2200 soon, with a break and close above these levels, most probably testing the 50- and 200-day moving averages at R2260. Should we break this level, will move my target on Naspers to R2380.
I am however EXTREMELY worried about the Death Cross developing in the 50- and 200-day moving averages, with a cross most probably seeing us test the R2050, with a break and close below this level, putting the R2000 mark in big danger. We saw how easily Prosus went through the R1000 mark this week.
My recommendation for short-term traders, is to wait before trying to go long (buy). The trend is currently not Naspers’s friend and will a personally wait for a confirmation of trend reversal, before I put some skin in the game.

NPN: temporary correction unfolding?Increased bullish technical reading over the last couple of days.
Came close testing its lower 2 standard deviation range - highlighting an overextended price action to the downside.
Retracting from RSI oversold territory.
Might be risky scenario with credit ratings.


NASPERS looking like a possible reversalJSE:NPN is looking promising for a possible upward reversal. The stochastic is currently turning up and it is trading at quite a strong support level which it isn't breaking through. I will wait for confirmation to enter.

Naspers Key Resistance LevelThe Resistance level of 255942 has lined up with 2 previous resistance levels as before shown by the red arrows drawn.
I think a break above this level would signal we headed for new highs, if we reach this level and fail to break above i think we might see a retest at the bottom of the upward moving channel.

Naspers bullish updateInverted H&S still in play on the daily timeframe. Channel updated following yesterday's invalidation of previous channel. Parabolic SAR and moving average still supportive of a further upward move. ADX to confirm. Could see a retrace back to 3400 level before upward move.

Naspers looking short term bullishNaspers trading in an updward channel heading towards the top of an inverted triangle. ADX, sequential SAR supportive of a bullish move.

Naspers 4hr chart Bullish channel base restestingNaspers in a bullish 4hr rising channel. good risk entries are offered here at the R3510 base for a potential move back up to around the R3685 area.
R:R 1:3

Top momentum shares: 5 September 2019The strength of the recent price trends is supporting these shares.
Calculated over multiple time frames (daily, weekly and monthly).
Price momentum is the force behind these share prices that will assist them most likely to continue with the upward price trajectory.
Momentum traders bet that the price of these shares is moving strongly upward and will continue to move in that direction until the trend loses strength.

Naspers longA break-out above the inverted head shoulder neck line by year end, could see NPN reach new ATH in the early part of 2020.
