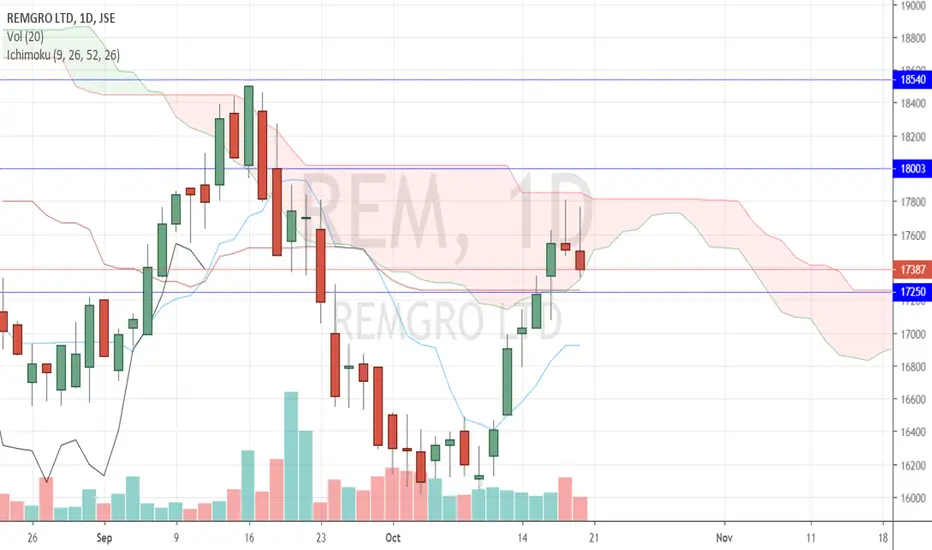
Test of the Weekly TenkanLast week we had saw a good break of the weekly tenkan which is the daily kijun level and the end of the week we seemed to have been heading to test this break 17250. So this week we look to see a test of this level and a bounce. If this bounce occurs we buy above 17250.
Entry: on close above 17250 after testing it
SL: 16849
TP1 : Weekly Kijun @ 18003
TP2: Monthly Tenkan @ 18540
Risk Management is 80% of job:)
REM trade ideas
$JSEREM DAILYRemgro DAILY is pushing up against the overhead down trend RESISTANCE. After a break and close above a month ago but failure to follow through, high volume yesterday after a break to push the price back down back in to the trend. We wait for a break of the down trend and follow through. the WEEKLY RSI is pointing upwards supporting this view.

$JSEREM DAILYRemgro has gone back into short term DAILY range. We can expect it to now test the top of the range around R173.50.

The Top 5 shares with the strongest bearish trendMeasured over daily, weekly and monthly time frequencies
The universe is the constituents of the JSE All Share index.
Some financials!

REM H&S FormingREM Forming a H&S Pattern Again in this TR
after significant Resistance / Support breakDown

Remgro DAILYRemgro has broken out of the short term horizontal range. Target is now around R180.50 where the next horizontal resistance comes in and the over head down trend resistance both meet.
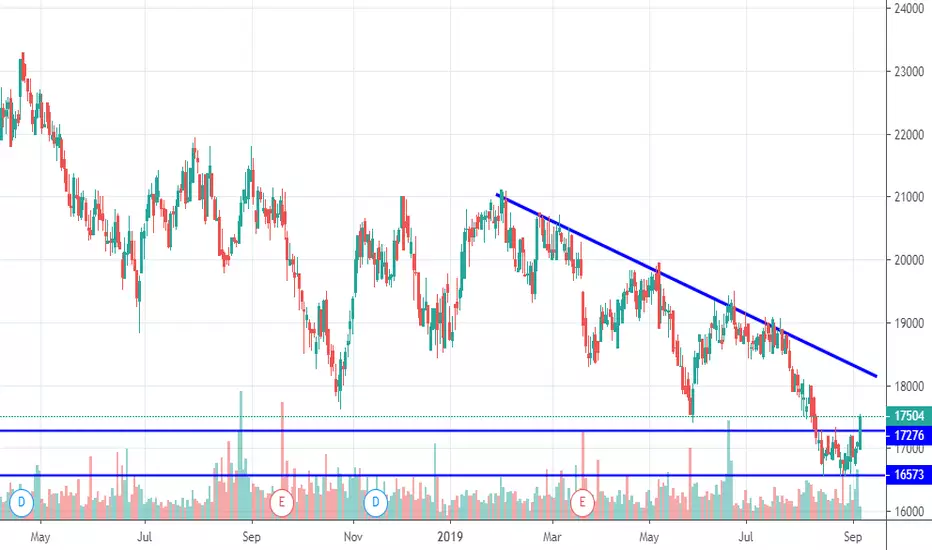
$JSE-REM weekly chartJSE:REM
Looks very bearish. Big flat bottom triangle made.
Target some 50% lower.

REM Dark Cloud CoverJSE:REM formed a "Dark Cloud Cover" pattern at a resistance level. If it confirms, I will enter a short position.

Remgro Ltd (REM)This morning, investment holding company Remgro Ltd has caught my eye as a short to medium term trading opportunity.
At it's last reporting date, the company indicated that it's Intrinsic Net Asset Value Per Share (NAV) stood at R230.23. At yesterday's close of R169.92, this represents a 26% discount to NAV which is also one of the widest in recent years. Typically, investment holding companies trade at a 10-15% discount hence the current discount of 26% may present an opportunity for traders to purchase the share in anticipation of a narrowing of the discount to within a more normalized range. Technically, the price is trading at the lower boundary of a long term downward channel while the RSI is trending upward while the MACD has made a bullish crossover.
Trading Plan:
Buy REM at current levels (16992c) or better
To protect capital, use a stop-loss of 16440c
Take Profit Target of 18200c


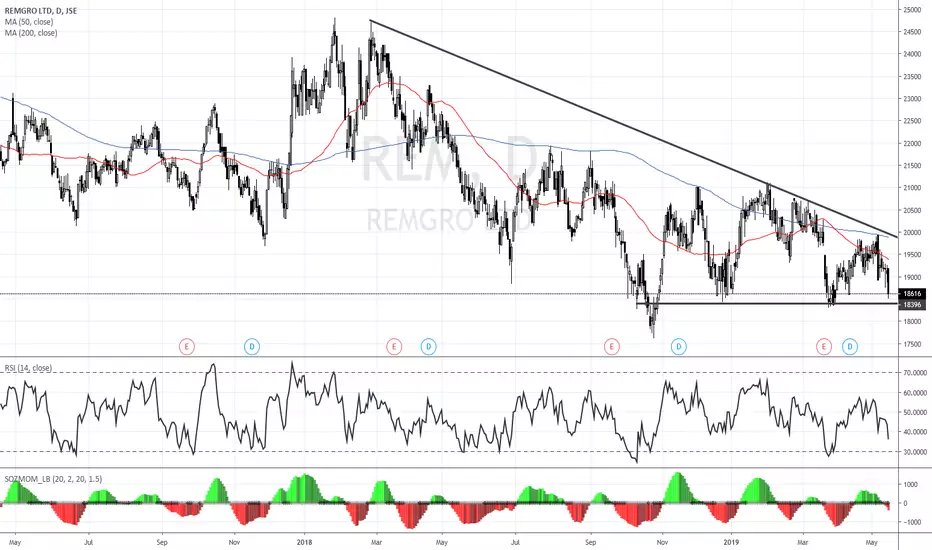
Should I stay or should I Go...Remgro?Remgro has been on a slippery downward slope since the beginning of 2018. When we have a closer look at Remgro's longer-term price movement, we will note that the downward movement might be a lot deeper. Since March 2010, Remgro traded at an average discount to its Intrinsic Value of 16.7%. At the current R179.95 levels, the discount, however, now is at 21.7%, which got my attention as a possible value play.
Technically, the share price found (bottom) support at R176, three times already, creating a nice little a Descending Triangle pattern. Should we see an improvement from current levels, with break and close above the 50-day moving average (first target) at R186, could see the share price test the resistance level at R189. This coincides very well with the historical average discount to intrinsic value, which should see the share price trading just above R188.
A break a close above these levels could be very bullish for the share price, with the next target becoming the above these levels could 200-day moving averages at R194.
A break and close below R176, could be seen as a bearish signal, which could act as a Stop-loss for short-term traders.

REM descending resistance breakoutJSE:REM has broken through a descending resistance level. If it confirms by closing above it at the end of today, we would be looking at a long position tomorrow.


How Low can you Go...Remgro?Remgro is getting very interesting. Despite the fact that the share price is getting closer to the bottom support level of a Descending Triangle, the company still seem fundamentally sound and somewhat oversold according to its 14-day RSI. Consensus target price (according to Thomson Reuters) on $JSEREM is still R234, which make current levels very interesting for a entry level. Should we see a recovery, first resistance levels should be the 50-day moving average at R194, with a break most probably looking to test the top of the triangle (which is also the 200-day moving average) at R199.

Piercing Line ReversalA PIERCING LINE has formed on JSE:REM .
A piercing line is defined by the following:
- After a preceding downtrend,
- Green opens below previous days close, and closes above 50% of the real red body.
- Bottom reversal signal
- Candles must be different colours.
Because of this, along with the upward channel that it has been trading in, I entered a long position on opening this morning.

REMGRO (REM) 4-HOUR TIMEFRAME SHORTPrice is currently moving in a steady downtrend, whilst also making higher lows, characteristic of a symmetrical triangle pattern. Prices broke out of a bear flag pattern and we can expect further continuation to the downside. Traders can possibly scale in after a corrective move. The target will be the trendline posing as a support.

$JSEREM definitely one to monitorRemgro will be a share I’ll be monitoring closely over the next few weeks. Nice little recovery that started in October last year, bringing the price now very close to the Apex of the Symmetric Triangle pattern.
A break below the support (lower ascending trendline), could see us test R193.60, with a break through those levels, most probably testing the R185.60 levels again.
A break above the resistance (upper descending trendline), could formally break and keep us in the R200 levels, with R211.30 being my first target. A break through those levels, could possibly take us back to R218.30.
On 7 March 2019, $JSEREM formally had a Golden Cross, which makes a bullish case for the price movement.
According to Thomson Reuters consensus, analysts currently have a price target of R236.67 (19% upside) and a 1yr forward PE of 9.5 times.

$JSEREM Remgro Steady down a slippery slope - year 4Large diversified and going nowhere. Much like the South African economy.

Remgro Double Top TargetRemgro Ltd. is an investment holding company established with effect from 1 April 2000, after the restructuring of the former Rembrandt Group Ltd. The Group's interests consist mainly of investments in consumer products; banking; healthcare; insurance; industrial; infrastructure as well as media and sport. The company's activities are concentrated mainly on the management of investments and the provision of support rather than on being involved in the day-to-day management of business units of investees. Subsidiaries not wholly owned include listed companies with independent boards of directors on which this company has non-executive representation. Non-subsidiary investments comprise both listed and unlisted companies not controlled by this company and which are mostly associated companies due to significant influence and board representation.
Technicals
This bullish correction has completed 5 waves which usually means there will be a break to the upside now. It's unusual but sometimes corrective structures form a 6th wave as well so I will still be careful of a reversal when price reaches the top of the structure. A break of the structure currently has a target exactly at the previous high. Smaller time frames will give an entry for the long.
Happy trading!
Linton

REM at strong supportJSE:REM is looking good for a short soon. The stochastic, MACD ad EMA's are all pointing in that direction.
However, it is at a major support level at 19500. If it breaks through this level convincingly, I will consider a short position.
It might just bounce off of it and continue upwards.

$JSEREMJSE:REM
Weekly chart making symmetrical triangle.
Break bellow will target low from February 2014
