SAPPI, will the downtrend break higher?SAPPI is currently holding the 38.2% retracement off the highs as resistance. Looking for a break of 4260 to go long, or a drop back to 3721, (or 3495). Target 5100
SAP trade ideas

SAP - 1D - STILL HOLDINGI Am in the red down almost 3% with this stock. Still holding. Sappi been hit by Civil unrest in South Africa, more specifically Kwa zulu Natal. Might be a double bottom on daily chart, which could see the price go to about 52.00 should it play out. Will play the waiting game.

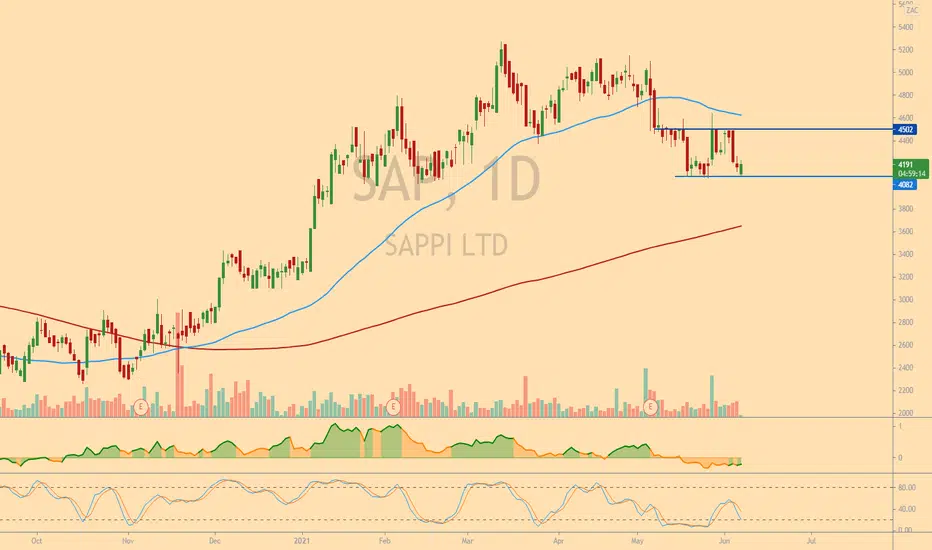
SAP Sappi - Wait for the LongClosed above previous resistances, lets retrace after this fact and collect liquidity below for a nice move.
Unless we are holding here already for continuation.

SAPPI Touching 200DMA. Will it bounce?JSE:SAP Touching the 200DMA today, with the 38.2%retracement off the lows, and 127% expansion off the highs coming into play.

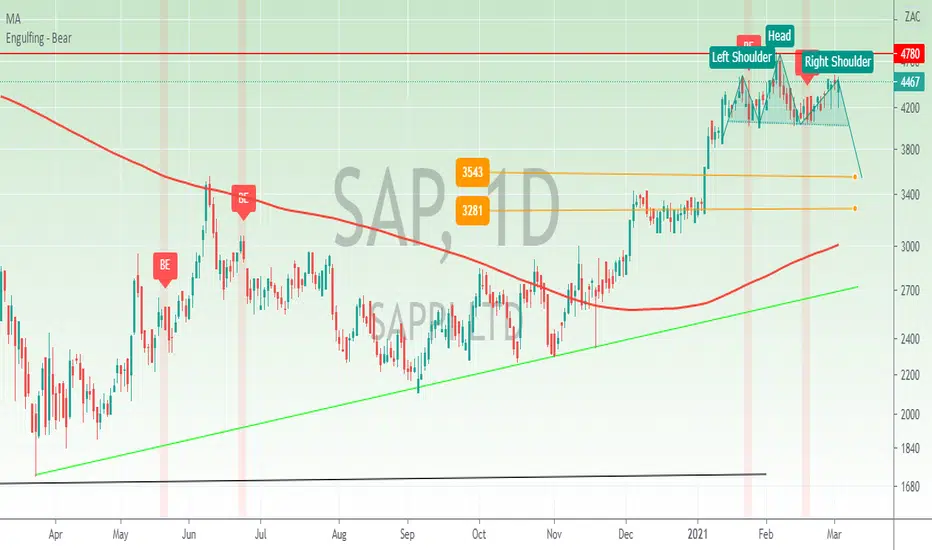
Sappi short term short We formed a possible Head & shoulders here . a Daily close below R 40 might be the trigger here for Possible R35 1TP and R32 as a 2nd TP. be mind full that should this fail to break and a break of last week's high this will mitigate the idea and stay with the current range.

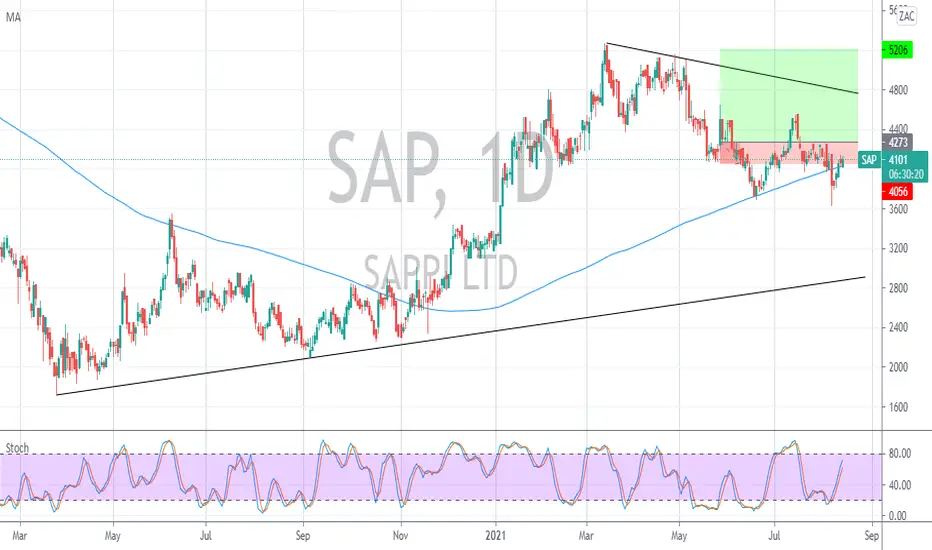
SAPPI rangeSAPPI starting to trade in a tradable range between R41 and R45. Breaking above R45 we can see a move to recent highs.
Breaking below support a move to the 20DMA most likely.
Trade ideas are my own and not financial advice.

Sappi bouncing off the multi year range's bottom.Sappi seems to respect the bottom of the multi-year range. It did however trade in this R22 - R35 for about four years and some change between 2009-2014. It could take a while before the break through the R35 resistance. If history is anything go by. but waiting for my 30w EMA to cross through the 60w EMA first to confirm the up trend on the share


Sappi holding the 50d EMA nicelyAccount balance: R8013.80
Entry: R47.58
Stop loss: R39.72
Risk per share: -R7.86
Quantity: 16.20
Risk ZAR: -R127.33
Risk: -1.59%
P&L: +R33.66 (+0.2%)
Sappi has been looking quite nice. It tested the 50d EMA holding it quite nicely. Ending the week with a bullish engulfing candle. There’s a decent resistance level at around 4702c. Looking for a close above my last entry level at 4758c then I will add to the position

SAP another leg higher?Sappi having a great run at the moment. Testing previous break in the form of a flag. If triggered then target R52.50 and R55.00

A very happy SAPPI- It looks like the breakout is just about confirmed for this stock. All that needs to happen now is the "Kiss goodbye"- A Pullback to around R46.00 would signal a test of new support and thereafter, I wouldn't be surprised if we saw R60.00 as the next stop.

SAP - 1D - ANALYSISStochastics overbought. Numerous bearish engulfing candles. Possible head and shoulders forming negative. Recent results out not so good and negative divergence present. I Will wait for pullback to Fibonacci levels before considering a trade.


SAP - SAPPI - (2.7 : 1)Sappi with a strong day yesterday breaking above R35 resistance and looking very solid on its way towards the R47.80 target.

SAP This note is an extract from my weekly research report.
Sappi Ltd: On Thursday we saw the share hit a 13-month high of 4799c as it saw buying activity continue following the release of it's Q1 results. Reviewing the monthly chart, the chart structure remains very positive over the long term. Having recommended the share at 2627c in Q4 2020 (08-October) the name is now +82% from the recommendation. Over the medium term, the weekly chart sees the price potentially entering a period of consolidation as it has rejected the swing highs extending back to December 2019. While the weekly RSI’s rank as ‘strong’ and ‘near overbought’, a buy/long risk to reward is unattractive at present. For tactical/short term traders, a pullback to 8-day and breakout level may be an opportunity to accumulate for an ultra short term rebound. Know your time frame. Weekly Chart Below:

Round bottom, cup and handle and Head and shoulders. Talk about having wind at your back. SAP looks very good as it looks to break the 4680 resistance. If it does my target for SAP is 7650

Sappi entrySappi 2380-2480...Might have missed it, but still looking.
Repetitive H&S targeting lower support of upwards channel.

JSESAP - Long Idea- Sappi is holding above its 200 day moving average and we could have possibly seen the bottom for now
- Entries closer to R25 will give a more favourable risk/reward
- Stop loss will be below R23 with intial target zone of R35


