SAPPI approaching strong resistanceSappi $JSESAP is approaching strong resistance. Previous support line turned resistance as well as 50 day MA will provide short term resistance but there is also a longer term downtrend that will need to be cleared at around R42 before entering a long position.
SAP trade ideas

#JSESAP SAPPI - 4HR Short Idea- Price is up against previous support / now resistance
- TP & SL on chart
- MANAGE YOUR RISK -
Disclaimer: All ideas are my opinion and should not be taken as financial advice.

SAPPI LTDThis is currently at a volatile zone, therefore looking for a perfect buy signal would be advisable, but I am looking for buying this stock

$JSESAP - Breaks lower on intra day basis (4hr)$JSESAP broke below the rising trend line (3719) and opens further downside

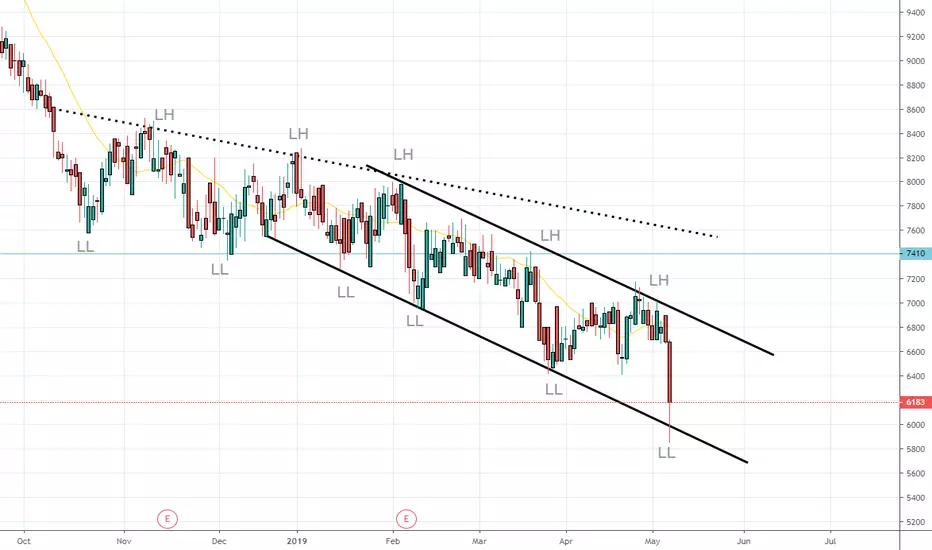
Channel on SAPPIJSE:SAP has been trading in a downward channel for quite a while and has reached the bottom of the channel and seems to be bouncing off. We can expect a short upward move towards the top of the channel. This is also being confirmed by the stochastic.

$JSESAP Sappi. Important to take note of fake breaksSappi broke a defined channel to the upside last week, followed by a fake out and break back into the channel. It is important to take notice of fake outs like this because it usually results in a selloff as a result of trapped longs positions. People buy the breakout in anticipation of a good move upwards (many times with leveraged positions) and when the share turns they are trapped in their positions. Trapped longs will many times sell at market to cover any losses. Even when a the price of the market moves up a little they sell to also cover losses. It creates sell momentum that can last longer that most think.
Stop losses in events like this can save you a lot of pain.

SAP Broken through fractal levelJSE:SAP has broken through quite a significant fractal/support level. If it continues downward, I will enter short.

JSE:SAP Sappi Next Leg DownThe markdown of Sappi has taken a pause but is set to continue. Some volume and negative divergence on the volume RSI points to a continuation of the downward stride.

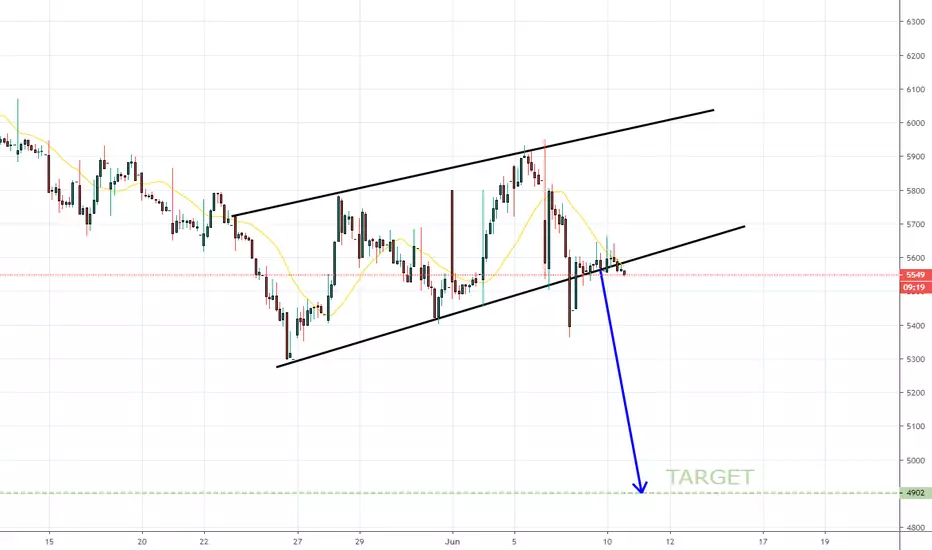
$JSESAP Sappi. Testing upper channel. Watch for a breakoutBreakout targets would be 4900, 5500. Wait for the breakout on the daily chart.

SAPPI breaking to the upside on Daily chartSappi is breaking up today after a 90 day consolidation.
RR : 2:1

Trade Idea - Sappi (SAP)Trading Plan:
Buy SAP below 4460c (last close was 4533c)
Stop-loss: 4170c
Take Profit Targets: 5110c and 5300c
JSE:SAP

SAP: look at that bullish divergence!Using the RSI to calculate bullish/bearish divergence conditions over multiple time frames (daily, weekly, monthly).
Divergence period used is 8 periods (Fibonacci number).
Bullish divergence is when the price is making lower lows, while the indicator (RSI) is making higher lows.
Indicates underlying strengths. Bears are exhausted. Warning of a possible trend direction change from a downtrend to an uptrend.

SAPPI Up against resistance on HOURLY chart- Wait for candle to close to confirm short entry.
- SL will be above the high


JSE:SAP Sappi Markdown continuesAfter the distribution, Sappi is being markdown and is still continuing searching for the bottom of the downward stride.

SAP - Long Term SupportWe may derive the following from the Monthly SAP chart:
1. Price has been stuck in a major bearish trend.
2. A long term support level is approaching.
3. A bid is most likely to occur at the demand level (purple box).
4. Monitor price action and watch for further buying potential.
5. As always - maintain your risk.
Note: The views provided herein do not constitute financial advice.
Update idea


$JSESAP Hourly channel feels bearish - close below R56 confirms$JSESAP Hourly channel feels bearish - close below R56 confirms. Weekly target still R49

Respects channel support Trend still down - double top still in play on the weekly chart. Profit taken today on tactical allocation & I continue to hold my core short longer term positions. I will monitor for new ST entry levels.


SAPPI upward move possibleJSE:SAP has currently broken through a previous support level as well as a fractal level. If this is confirmed by a close above this level, we can possibly be looking at an upward move.
