Standard Bank setting for the skiesStandard Bank is announced it has concluded an agreement with its controlled company, Liberty Group, to buy all the remaining shares that it doesn't own. The transaction is awaiting regulatory approval.
On the charts, SBK has been trading lower and it is approaching a minor uptrend line, which could be a turning point to the upside. The potential yield is 60-84%.
SBK trade ideas

Standard bankSBK continues to face resistance at the 140 area.
Could it be developing a double top technical pattern? Only the 117-120 support area will confirm!

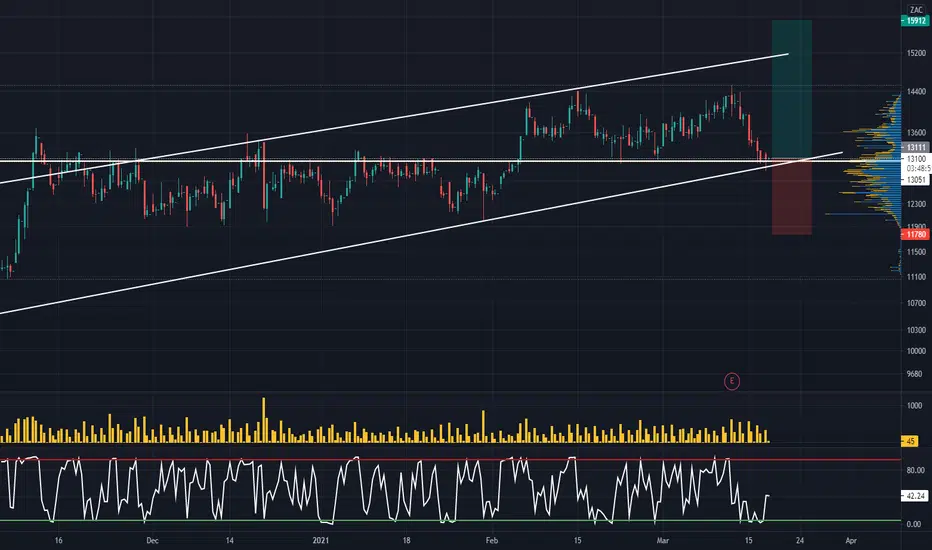
SBK - Short trade ideaSBK made a pretty ugly reversal candle on Friday, although after our close things in the US seemed a lot smoother. A close below R132.50 could put it under pressure with R130 as first short term target and big target at R120. It has been the weakest of the lot, so should they all start moving lower SBK should be the 1st to move down.

SBK IHSSBK possible small IHS forming on daily chart. Trigger will be a close above the neckline. Stop loss a close below right shoulder. Target between R130 - R133.
Ideas are my own and not financial advice.

STANDARD BANK - Long idea- Price has moved back over the 50 day moving average after spending considerable time consolidating and forming a base
- Any pullbacks towards R123 will be an opportunity to enter long targeting the wedge top around R130
- As long as we stay above R116 , the bullish bias remains.
-- MANAGE YOUR RISK - -
Disclaimer: All ideas are my opinion and should not be taken as financial advice.

STANDARD BANK (SBK)It’s not my favourite bank share but a few reasons to look at it.
Just keep in mind, Bank stocks are traditionally very sensitive to Local economic conditions.
Weekly Chart :
It’s been in a channel since Apr20 and looks like its just started Elliot Wave 5(weekly chart).
A bit late in the game but would have like to get in on wave 3!
Since Sep20 it has been in an uptrend and Mar21 started its down trend.
It passed the 62fibb and the candle wick nearly touched 76fibb.
Incidentally, the Elliot wave 5(weekly chart) target shows potential to R163.
On the daily chart :
I’ve had this share on my watchlist since it started its mark down phase in march21 and went to a low of R114 (4may21).
RSi was also at the bottom and shows a reversal around end March -> end April21.
Moving Avg as of 25/5/21 – (14h00) :
50sma = R 123.07
65sma = R 126.28 (candle wick went through it today)
200sma = R 121.41
If it keeps on this trend, we have the next resistance at R129.40 then again R133 (62fibb).
Has to break R125.59 (38fibb) convincingly(i.e. not a "fake breakout") and let’s hope she goes to 62 or 76/78 fibb.
I think this is a good long-ish termer for the next few weeks / months till it hits it potential target on the upper line of the channel (eventually).
I was planning to buy at R119 and then had to opt out just after the financials were released. I was waiting for it to finalise its downtrend.
Getting a nibble in at R119 would not have been a bad idea, and now that its at least looking more positive, the potential looks even better.

A nible on Standard BankI am bullish on the financial sector, major banks are trading above the 200EMA. JSE:SBK can push higher from here. It's a reasonable 1:3 risk:reward.

Pairs Trade Update: Take Profit on Long SBK/Short INLWe have entered the target range on this pair (2.29-2.35). Take profit for a 5.8% return over the 2 weeks (idea published 10 May).

Standard bankSeems like SBK has been flagging on the weekly timeframe for a potential move lower; below 100.


Pairs Trade Idea Update: Long SBK /Short INLI promised myself I would also focus on a market neutral strategy. Yesterday (Pre-Market, Monday 10-May) I add 1 idea to my report: Long Standard Bank (SBK)/Short Investec (INL). As of 2pm on Tuesday afternoon, the pair was higher by 4.84% over the 2-day period vs -1.6% for the All Share Index for the same period. It closed +4.33%.
Market neutral strategies are used by traders to reduce risk while simultaneously attempting to generate alpha. To achieve this, traders make use of pairs trades which involves matching a long position with a short position in two stocks with a high correlation.
I'll continue to monitor for opportunities in this strategy.

SBK - R120 SupportSBK once again holding onto that R120 after its dividend last week. It also did volume on the session after the dividend so there could be signs of buying returning into the stock. Long idea remains as long as R120 holds. 1st target at R130 and full target at R140


Standard bankPrice back at major support on the daily chart.
Will it hold? Maybe, maybe not.
There is also a H&S like pattern developing.
Should the support/neckline break, R100 is the measured target.

SBK - Support at R120SBK has found support once again at the key R120 level. Friday's close triggers a long idea with 1st target at R130 and full target at R140. Stop loss a close below R120.

SBK - 1D - RETRACEStandard bank has made a nice retrace to Fibonacci levels, Stochastic oversold. Might target the 200dma

SBK - Target Reached - Now Looking ForwardTarget Reached. Looking Forward - Extract From My Upcoming Weekly Report (29/03-02/04)
The share traded into our accumulation zone, which was the range support and the 200-day simple moving average, from which we saw a 700c rebound 11900c to 12600c (trade idea target range). The declining 8-day EMA may now act as a 'first' resistance level. Expect consolidation around the 8-EMA with a possible scenario being a moderate pullback toward the mid-point of Friday's trading range. If you missed the buy/long, only look to enter if the share pulls back and consolidates. Shorts/sellers, using the 21-EMA near 12900c-13100c as a distribution area.
Chart Time Frame: Daily

SBK - Following The Recent Sell-Off, A Speculative Buy/Long We may see a few red dog reversals in the market today. Speculative Long on SBK.
Entry 120.44
Stop 117.50
Target: 126-127.50

SBK - Showing some downward momentumJSE:SBK has started showing some strong downward momentum with today's price action. I will keep an eye on this one for confirmation of a short as the stochastic, MACD and EMA's are all showing downward pressure.

SBK - 1W - POSSIBLE DIVIDEND PAYERWeekly stochastic show overbought position and bearish engulfing candle at the top is also negative. I Would hold on to this stock, however if it breaks through the bottom of the channel it could fall to 0.382 and even 0.618 on the Fibonacci retrace. That is were i would consider buying if i were not in already. 200 day MA is also still in bearish territory.

