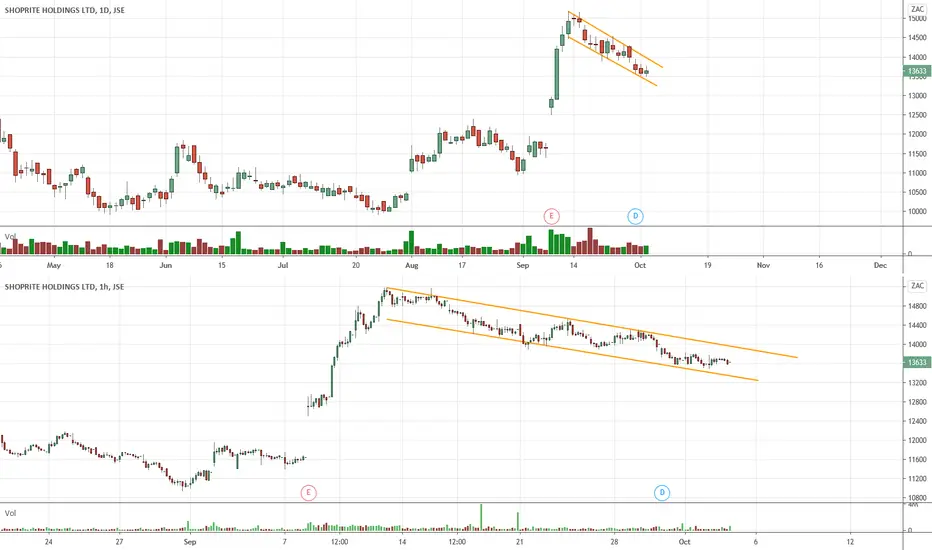
JSE:SHP Shoprite Up Thrust and Failed TestShoprite had a push to break the yearly pivot point with some volume but after a the upthrust (UT) there has been two lower volume test that has failed. A large reversal bar yesterday also indicates the path lower is open now. We are likely to test the 10000 level and potentially breaking it. This looks like a backup (BU) after the breakout of the previous trading range (see posts below)
SHP trade ideas

SHP - Inside bar + bull flagBreak of R137 triggers long idea. With 1st target at R150 and full target at R170. Stop loss close below R130

Shop RIGHT. (SHP)Shoprite currently trading near support "zone" of around R130.00 after a pretty decent pull-back off recent highs. I think current levels can be bought ahead of their results on the 16th March. I think any surprise to the upside will result in a large rally. They have a tendency to surprise...Just look at what the price did after their last report...

Bearish Engulfing at ResistanceA Bearish engulfing candle formed on JSE:SHP on 17 Feb. This was followed by a cross of the EMA's and the MACD. All of these indicate a change of momentum and we could be seeing a move to the downside. There is a gap that formed in September last year that we ight be looking to fill, failing that, it might find some support at the top of the gap.

JSE-SHP: Rounded bottom forming (W)JSE-SHP: Waiting for confirmation at 15176 (Weekly close)
TP 17645

Shoprite Group UpdateLong target of 145 reached. The daily close above 145 resistance now projects a target into the 160 region

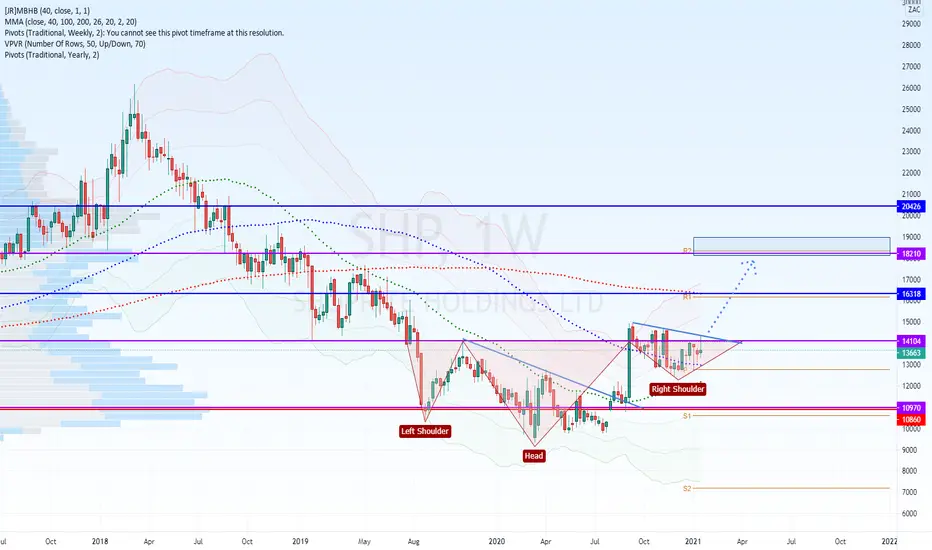
Inverted Head and Shoulders BreakoutIt would seem that the Shoprite Inverted Head and Shoulder is finally breaking out. Initial target @ 163 (YR1) and full target between 182 and 195. Stops can be considered just below the Daily 100 SMA @ 135

JSE SHP LongMeaningful bounce of DMA50 with target of 145. If 145 is overcome convincingly it validates a cup and handle formation with a target of 160.

Cup and handle on ShopriteA nice cup and handle the stock. It broke the handle now I’m waiting for a close through the 15000c resistance. Volume picking up as the stock was breaking through the handle(flag). My target for Shoprite is 19300c For now I wait for the break


A nice Cup and handle on ShopriteLooks like the cup and handle formation on SHP is increasingly looking more likely to playout. I’m looking for a close on the other side of 15000c. With a stop around 12300c and a target around 19300c. And possibly higher. If the share breaks out of the bullish flag “handle” there’s good chance that it will break 15000c.I might look to enter on the break of the bullish flag, and add to the position on the break of 15000c

Inverted Head and ShoulderI think this JSE stock might be staging a recovery! There is a very clear inverted head and shoulders pattern with very bullish price action following the last diagonal breakout above the Weekly 100 SMA. I think a Weekly close above 141 could see a prompt move to initial resistance from the Yearly R1 and Weekly 200 SMA @ 160 and after a brief consolidation period (or re-test) a full target of 182 before the end of the year. Support will at present be provided by the Yearly Pivot @ 127
Multiple patterns on the shoprite chartA combination of a bullish flag, Cup and handle, and a bullish divergence on Shoprite. The share looks very good on the long side with some wind at our back. Looking to enter at the break of the bull flag, and then add to the trade on the break thought R151 confirming the cup and handle pattern. And accordingly adjusting the stop-loss. But for now my stop is around R123, below the low of the handle/flag.
Read the week 2 game plan - villagetrader.co.za

$JSESHP Shoprite Bullish looking flag buildingCurrently trading off support and building what looks like a bull flag. Watch for a bull flag break for a 16000-17000 target range. Suggestion is to take half position now on support and another half when bull flag breaks. Stick to stop losses.

SHP Breaking out?Hi Guys
So we can see Shoprite is breaking out of a falling resistance trendline here.
But the day is not over!
If it closes above trendline then I expect it to move up towards R135 (resistance) and potentially R144 (another resistance but also the point of control according to orders.
This is my view. I'm not trading this now. I already have one running.

SHP - Heading for gap closeApart from the double top that has formed, a massive bearish engulfing candle appeared yesterday with very strong downward momentum. If it continues down lower than the low of yesterday's engulfing, I will consider a short position with a target at the close of the gap from the 8th of September.

Cup and handle on ShopriteShoprite looking quite bullish at the moment. Once we close on the other of the 200 week EMA. The trade looks even better.


Bull Flag break - LongIdea is in play after it broke the flag on Thursday. Stop loss is a close below R136 with first target at R150 and full target at R175

SHP breaking trendJSE:SHP has been in a downward trend since mid September. It broke through the resistance level on the 9th of October and it went back down to test the level as support. If it breaks the high of the 13th of October, I will consider a long position up to the previous high of the top of the trend.

Shoprite Analysis I dont often miss the train but when i do, I regretfully sit and wait for the next one. Here we have shopright which i have been eyeing since beginning of July, my only reason for not catching this train was alarming results from my fundamental analysis which raised so many questions especially when compared with its competitors (except Woolworths). From R 100 a share, Shopright peaked to R 150 after amazing results where shared and a expected we can see the excitement dying down a bit. Looking at a daily chart however it does seem as though the share price is gearing up for a reversal as the recent rally has comfortably broken the hanging downtrend resistance that has been hanging since 2018.
Taking a closer look, we have a support line at R 132 and the share price seems to be respecting the uptrend support as well. If this trajectory continues, we will test the R 150 resistance again. A negative outlook will see the share price test and possibly break the R132 support line as excitement dies down.
Careful to note as-well that there was a gap created recently, and there is a chance as always that the gap would need to be closed.
For now I’m holding out and will probably wait for the next train.
Trade safe and good luck.

SHP - Bull flag formingBreak of R140 will trigger long idea. Target is R175 with stop loss to be determined according to swing lows which currently stands at R135