Top5 oversold/overbought according to RSI & ShopriteFTSE/JSE All Share Top5 oversold/overbought according to 14day RSI indicator as follow:
Oversold:
Intu Properties 21
Fortress Reit A 29
Ascendis Health 30
Telkom 32
Shoprite 33
Overbought:
Prosus 78
BATS 77
Northam Platinum 72
DRDGold 69
Trencor 67
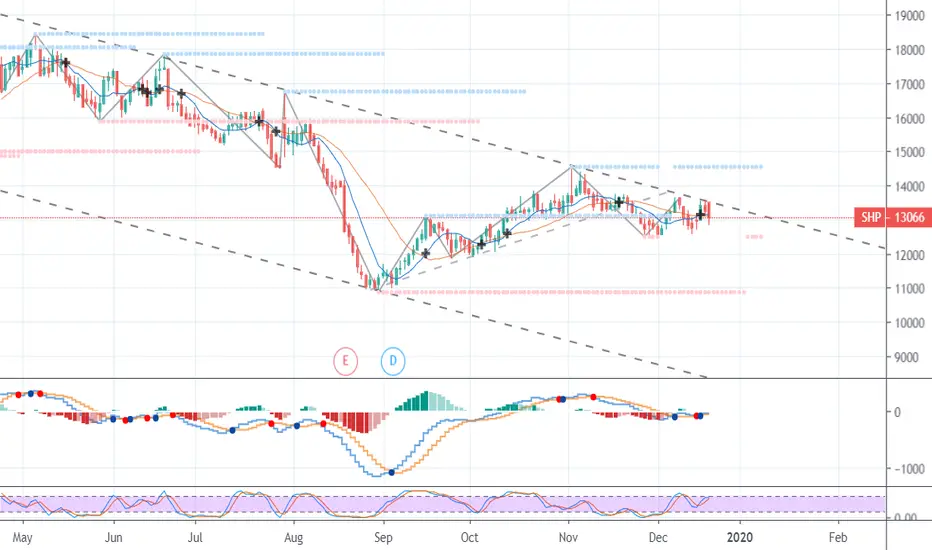
Spending some time on Shoprite. SHP been struggling to find a breakout from the current Descending Broadening Wedge pattern, which started its trend in October 2018. In short, a descending broadening wedge is considered to be a reversal pattern and is bullish indicator. Though the pattern is typically a signal of reversal, continuation of the downtrend is still possible. Since the end of August (2019), we've seen bounce off the bottom part of the wedge and a nice recovery in the share price since then.
What should also be noted is that since that recovery started, how many times the share price found support at R120 (current level). By doing so, we've seen that SHP created a short-term Descending Triangle pattern, which could see the share price test R131 over the short-term if support (R120) holds. Not only will there be short-term resistance at the top of the Descending Triangle, but also the 50-day moving average, which coincides with these price levels (R131). A break and close above these levels could be very positive for SHP, which could very much see the share price test the top of the Descending Broadening Wedge. A break and close above R140, would be a formal break of the downtrend, which could signal a reversal. Next target/resistance level will then be the 200-day moving average at R145.33, with a break and close above these levels bringing my medium-term target of R160 into play.
The share price finds itself in EXTREME OVERSOLD environment according to its 14-day RSI.
A break and close below R120 (support), could very much see the share price seeking out the previous support levels of R110, which will be my stop-loss if I was a short-term trader. It is for this reason why I would rather wait for confirmation of a bounce off the R120 support line.
On a fundamental basis, we still value the company closer to the medium-term target (above). Read our full report here: oldoak.co.za
SHP trade ideas


$JSE-SHPJSE:SHP
With all this strength in the markets $JSESHP can't move higher. Imagine if some weakness come to markets.
Massive head and shoulders in making. Break of neck line will open target around 10600/10800.


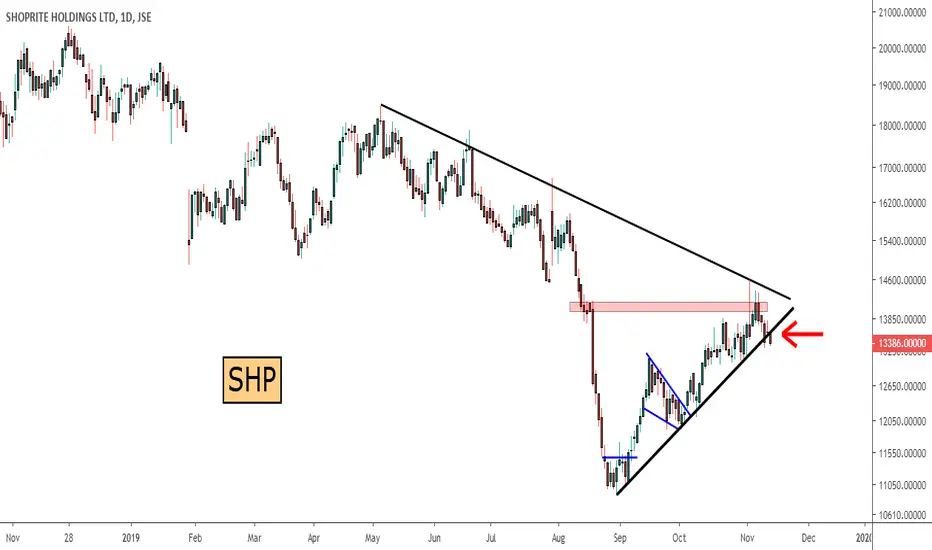
JSESHP - On SALE - Looking bearish - 200ma trending down
- Price reversing off major downtrend
- Head & Shoulders pattern in place
- MANAGE YOUR RISK -
Disclaimer: All ideas are my opinion and should not be taken as financial advice.
JSE:SHP


Shoprite Yesterday, the share price of Shoprite looks to be forming a bullish harami candlestick reversal pattern at the support level of the upward channel. The candlestick reversal would be confirmed if today’s candle closed in positive territory and above the mid-point of the previous candle. In this scenario, it suggests the end of the short-term pullback and continuation of the longer-term trend. The 14100 area would be the upside resistance target from the reversal, while a close below the low at 13045 would consider the failure of the bullish assumptions. www.ig.com

JSE:SHP Shoprite Markdown StartingAfter breaking the distribution trading range (TR) we have seen a backup to the TR and now price is breaking lower. This looks like the start of the Phase E markdown. Increased volume on declines and decreased volume on attempts to rally indicates supply overcoming demand and large interests distributing the stock.

SHP: Low risk Long positionShoprite is making higher lows and have bounced off support while showing hidden bullish divergence. Buy at R136, stop below R132.50 and first profit target at R145.

SHOPRITE5 wave Impulse completed, now we go short as per prediction from the other week, we selling the pullback

Shoppies $SHPStanding back and checking the long downward channel in SHP is rather scary. Last push didn't break the negative channel

SHP SHP
- Price breaking incline support zone
- MACD bearish cross
- RSI pointing down, attempting to cross into the bear zone.
PE 17x vs -20 percent HEPS + Div Cut by 34 percdent
( SPP taking market share too?)
SHOPRITECurrently trending inside the leading diagonal, I anticipate the breakout on support then drop.

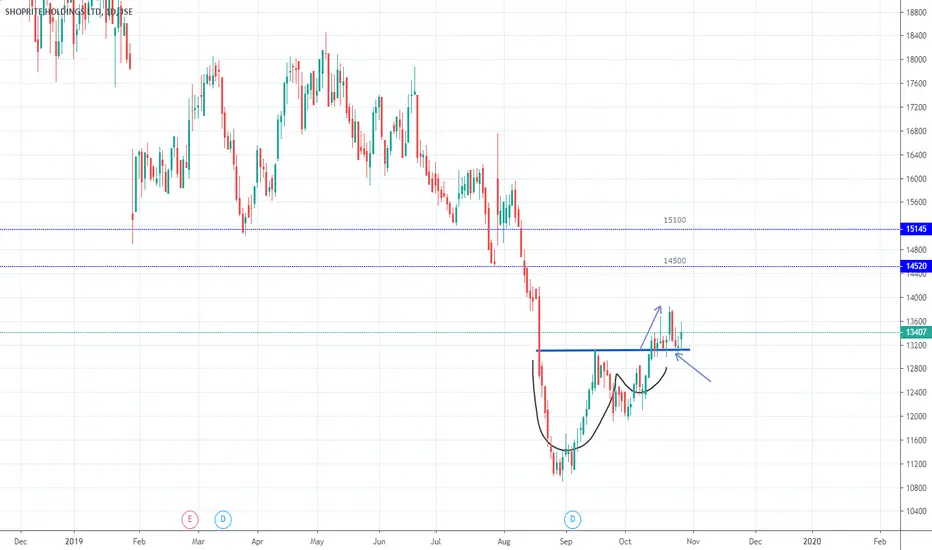
$JSESHP Cup & Handle breakout constructive Shoprite looks constructive for the bulls with the formation of the cup & handle formation. The break above the patterns resistance level @ R130 is an important technical development for the stock which should hopefully result in both technical targets being reached in the days/weeks ahead. First target at R140 is measured by taking the distance of the handle and projecting it upwards from the breakout level at R130. The second and full target level is measured by taking the distance of the bottom and top of the cup and handle formation from R110 and R130, and measuring it from the break, to give a full target of R150. The level of R150 was previously support before the stock broke down and will now likely act as resistance on the way up. Also take note of the 200 day moving average (green line) which sits at R158.40 currently and moving down daily. This could likely move lower to R150 by the time the price has caught up and would be another point of resistance which the stock will encounter should we see a swift movement higher as expected.

SHOPRITE - Idea - Bullish cup and handle playing our
- 1st Target as been met (Flag breakout)
- Targeting R155 zone JSE:SHP
- MANAGE YOUR RISK -
Disclaimer: All ideas are my opinion and should not be taken as financial advice.


SHP Gaining momentumSHP as previously indicated Short
break down of support
close below expected
fed cut of 25 basis points fueling momentum
of stock sell off


Shoprite Holdings LTD - Discount, Discount"Volume Weighted Average Price (VWAP) is the ratio of the value traded to total volume traded over a particular time horizon. It is a measure of the average price at which a stock is traded over the trading horizon." Wikipedia. (Blue Lines).
I use a rule of thumb, never buy/long above vwap and never sell/short bellow vwap. Technically we are below the higher timeframe vwap's but we want the best price we can get on lower timeframes IF a reversal happens here, so we risk a trade setup finding undervalued prices at certain levels.
This could potentially lead into a nice long term trade. Just use risk management and watch for that area in yellow circle. After that, you don't want to be in the trade anymore.
Let's see!

SHP close above resistance Flat top triangleSHP has closed above the assending triangle resistance
however the RSI is in overbought territory
could be a false breakout by SHP
i will see what today has in store
expecting a pull back or consolidation

SHP breakoutJSE:SHP has broken out of a symmetrical triangle and if it confirms above the high of yesterday, I will consider entering a long position.
