SASOL TO RISE??CAn we see the Sasol investors smiling all the way to the back very soon?? the stocks are expected to gain
SOL trade ideas


R430 on the cards Bull flag targets R430. Tough road ahead in terms of resistance levels. But still bullish oil price in ZAR longer term.


$JSE-SOLJSE:SOL
Published results today and they are looking good.
FINANCIAL PERFORMANCE
- Earnings per share up 112% to R23,92
- EBITDA up 10% to R27 billion
- Core headline earnings per share up 18% to R21,45
- Normalised cash fixed costs contained to below inflation target
- Dividend per share* R5,90 (3,6x CHEPS)
* Our dividend policy is to pay dividends with a dividend cover on core headline earnings per share (CHEPS)
Resistance is R42500, if it gets broken no resistance to 44500. This is short term view will see how market opens.

$JSE-SOLJSE:SOL
Trying to break from falling wedge.
If it does target should be in 470/480 area but don't forget strong resistance around 425.

Watching $JSESOL very closelyWill be monitoring Sasol closely for the next day or two. A nice little Falling Wedge that’s developing, with the share price now trading at the top of the wedge. I will be monitoring both the R415 level as first resistance point and then the 50-day Moving Average at R418.78 as a possible breakout. Should this occur, Sasol could very much target the R448 levels.
Should the top of the wedge hold, and we see a retracement, first resistance should be at the R383.50 levels. Bottom of the wedge currently at around R379 levels.
Sasol has been plagued by some bad news lately and an improvement in the $ZAR/USD could add petrol to the fire. I also seen a few brokers lowering their outlook on the company from HOLDS to SELLS, which indicate that a long position should be implemented with caution. Thomson Reuters 12-month consensus forecast however still see 23% upside in the share price. Personally, I still believe that Sasol is a quality company and might just start nibbling if we see a breakout.

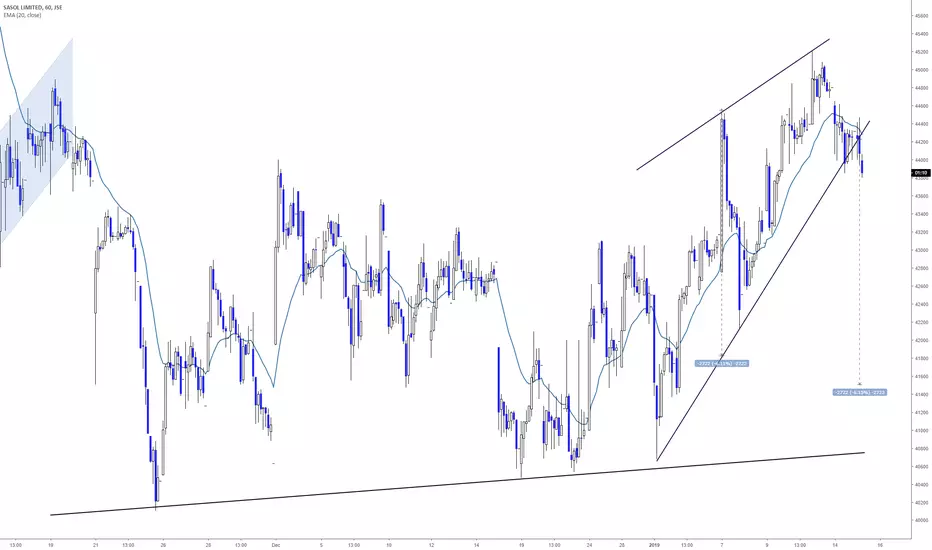
Short term buying opportunity Still bullish on oil in ZAR longer term. Short term trading opportunity on the hourly.
Target = R411.50, SL = R379

SasolTrend is still down on the daily chart.
Down-sloping trend line and 50dma continue to cap further upwards movements above the R423-R425 area.
Any price advances to that R423-R425 area could be used as an opportunity to Short.

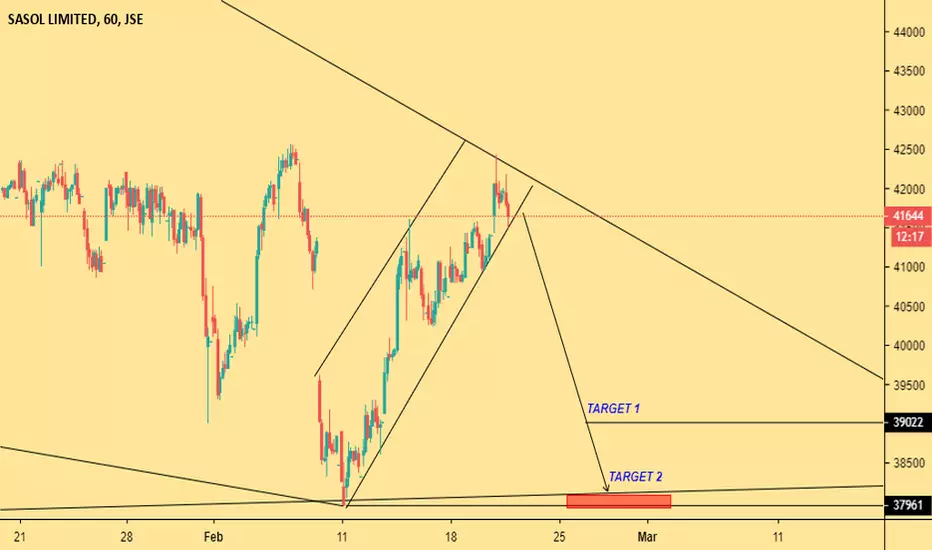
$JSESOL bearish flagJSE:SOL
On the verge of breaking bearish flag. Target still from earlier around 37000/37500 area

Bottoming on the hourly Currently up against some overhead resistance. Move above R424 targets R435, SL = R416

Sasol - failed break confirms a move lower to test R 400.00Sasol failed to break meaningfully above R 448.00 / R 450.00 resistance!
Been losing momentum with R 400.00 support in play once again… stronger ZAR set to take its toll.


With Current Market Volatility, Where is Sasol Headed?Sasol is an international integrated chemicals and energy company that leverages technologies and expertise of over 30 000 people working in 33 countries. Sasol develops and commercialises technologies as well as build and operate world-scale facilities to produce a range of high-value product streams, including liquid fuels, chemicals and low-carbon electricity.
Weekly: Coming off a perfect 78.6% Fib retracement level, I expect to see more downside ultimately breaking the lows at 35,000. I have a target level of 30,000 to 29,000 where I will be looking for signs of a reversal. The long entry from there should be a great trade!
Daily: The daily structure will complete in either 3 or 5 waves and I expect it to reach the targets as indicated above. There may be one or two interim pullbacks which will form this structure but as things stand now, I will only be looking to trade the shorts until we break the lows around the 35,000 mark.

Bullish Harami on SasolJSE:SOL is showing a bullish harami pattern, which is a reversal sign.
So, we can expect a reversal from the current downtrend.
If this turns up, we can expect resistance around the 450 and the 480 price areas.

$JSESOLJSE:SOL
Broke small bearish flag. If 47000 is broken will probably go and see 38000 in next few weeks.

Sasol ADR - Triple Top, Bear FlagSasol ADR Monthly, $33.42
- Triple Top: May '08, April '11 & July 14
- Since declining from $60, the share has developed a bear flag pattern.
- Recently we have seen the price being rejected at the upper boundary of the channel (flag).
- Bear flag break targets $21 over LT.
