Positive on Sasol.. I think...This is my first technical analysis attempt using what I have learnt so far.
Please do not be too harsh, feedback always appreciated.
Feel pretty positive on Sasol, have been for the past year since March last year. Made some good money and now trying to be more calculated in my trades.
Disclaimer: Not financial advice, just personal opinion on the stock.
SOLBE1 trade ideas

Dip coming for Sasol?Sasol stuck to the upward channel, RSI and MACD warning that it might be set for a dip - hopefully positive trend holds.

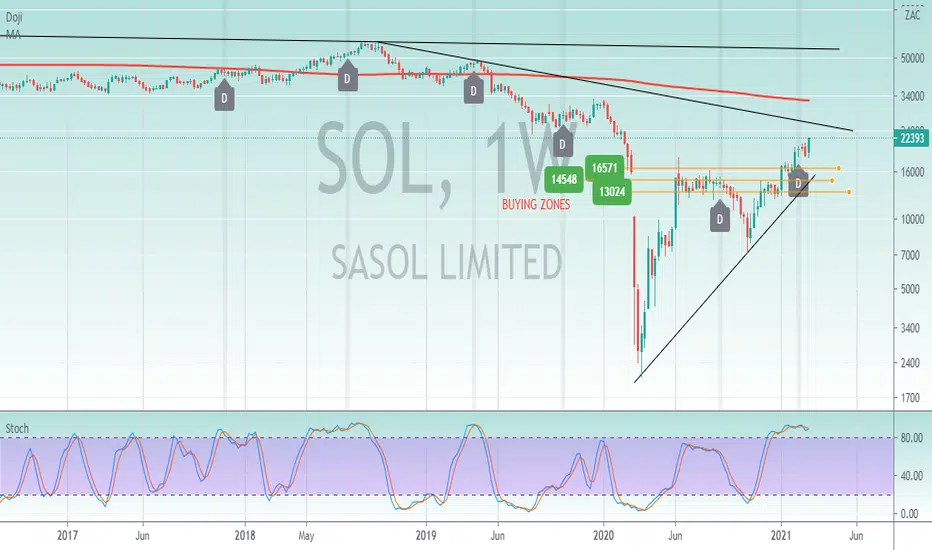
Sasol AnalisysIts safe to say that as of 01/12/2020 Sasol share price had a trend change as it officially broke the massive down trend resistance that as been there for a couple of years. The share price now sits comfortably above the R200 price mark and up almost 1000% from a year ago. They decided not to go through with a rights issue, the oil price is sky rocketing and debt management seems to be going well. Safe to say thing are really looking good for the company and investors have noticed. As it is still in recovery, the next price target is R320 which is an additional 39% from current price point. Depending on the interim results, we could get there by the end of the year.
The current uptrend has been moving in a similar pattern and if we assess the progress of the current wave, it would be safe to expect a bit of negative movement heading towards the uptrend support before another positive break out possibly to around the R 250 mark.
Overall Sasol is a long.

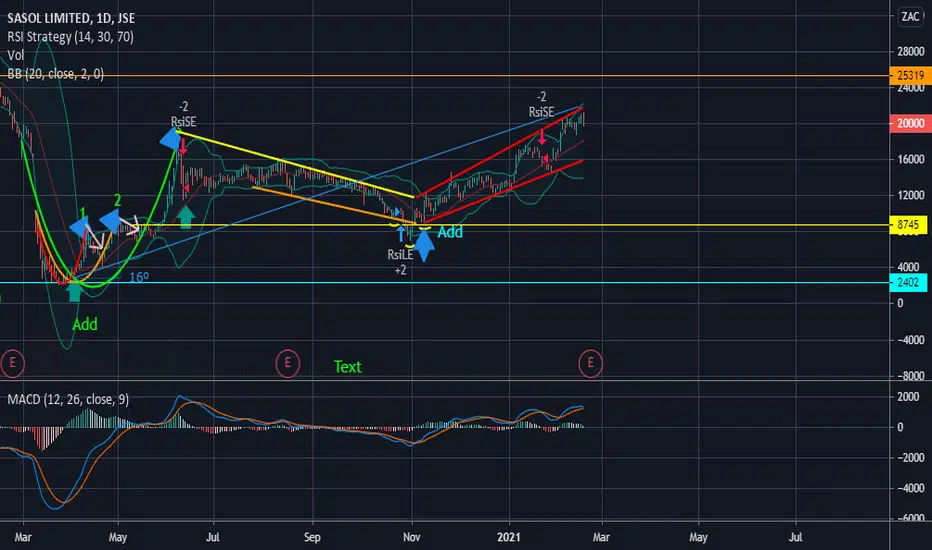
SASOL setup updateMy previous chart just need an update.
After the 8 600 entry position I proposed, Sasol is still holding firm as we approach the earnings report. Keep holding it and do not be alarmed if it retraces back to the 18 000 level. It is still above the 50MA, 200MA and the fundamentals are not providing any erratic downward movement (specifically the rights issue).
The current price movement is technically replicating number 1 on the chart, So we can expect some consolidation coming up at number 2 before it breaks above the 22 800 level or come down again.

Possible short on SASOLJSE:SOL is showing signs of a momentum change, and we could be looking at a downward move to the support level around 15500. The stochastic and MACD have both crossed down a couple of days back and we finally have confirmation from the EMA's that the trend may be changing.

SASOL MaturesI forgot to publish this idea on Friday morning.
We saw this during pre-market and took long positions immediately.
Wise to wait for pullback before entry here as Friday's candle moved quite significantly.
Happy trading.

SOL - 1D - PROBABLY NOT FAROverbought stochastic coincide with doji candles during a period of indecision and subsequent fall in share price, 200day MA still bearish. although i think the stock can still run due to increase oil prices i will wait for retrace to fibonacci levels before considering a trade.
SASOL TARGET REACHEDafter rejection at minor support level, the price spiked to the nearest resistance where we can either close off the buys (if you are trading) or hold if you are investing.

SOL - Bull flag in the makingLong idea triggers with a close above R195. First target at R200 and full target at R210. Stop loss close below R188

Buying SASOL at dip.SASOL currently trading below R200. We observed a retest at daily support (R185 - R190). If support is breached we could have a potential strong buy around R174 area.

Huge Gap in this chart. Do we play it? Given the bearish nature of the market as of late do we get puts expecting this gap to be filled? I say yes yes we do lol

SOL: heading lower?A BEARISH bias is applicable below 19402.
Trade setup probability: -70%. Target: 18438. Stop-loss: 20031.
Downside price momentum supports the bearish trend direction. RSI is at 53, leaving room for further downside price potential.
Volume is also supporting the bearish bias.
Remains a risky trade!

Sasol sellSasol will drop to the 12000 mark or turn on the 13999 mark but its selling from current price

Sasol Long Term Cyclical PredictionThis Chart is for Academic purposes --
- Looking at the length of the previous Bull Markets off the lows
- Looking at current Market Sentiment, lots of new traders entering the market through platforms such as Easy Equities etc.
- Emerging market expectations in general after looking at US and Europe Stocks

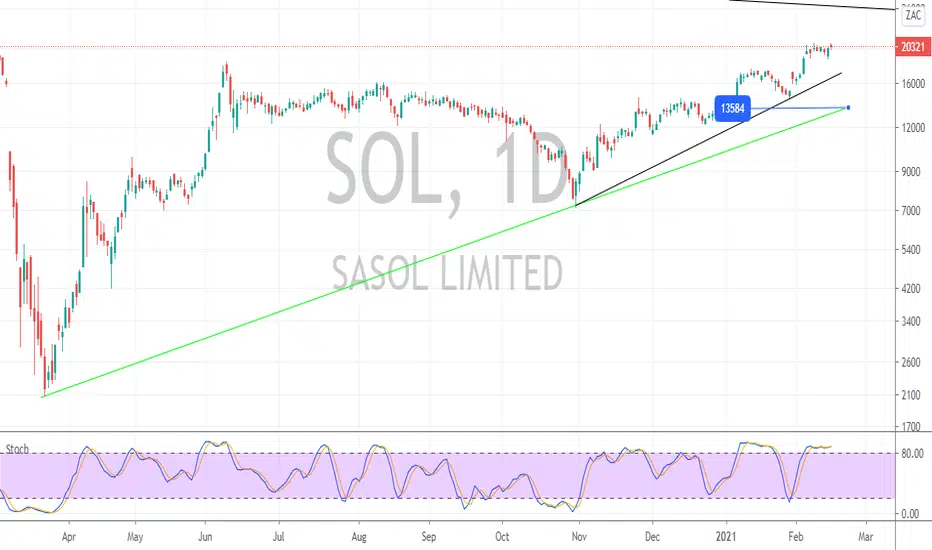
SOL Long ContinuationSOL My recommendation to go long
after successful reversed Head and Shoulders
and then to add again after C&H has panned out
i see more upside for Sasol i am sitting on a 19 Deg growth angle
will have to wait and see how far Sasol can Recover
SOL - 1D - PROBABLY NOT FAR .Stochastics overbought. Oil price and dollar not working in their favour, will wait for a pullback before entering a position


SOL LongSOL still climbing up in the channel doing great so far
i expect with all the precious metals boom that more chemicals will be needed
which is great for Sasol
Taking a look at SasolThe upward channel is doing very well!
I notice it's at the previous high after the big sell-off.
Indicators looking good, let's hope it can go higher!

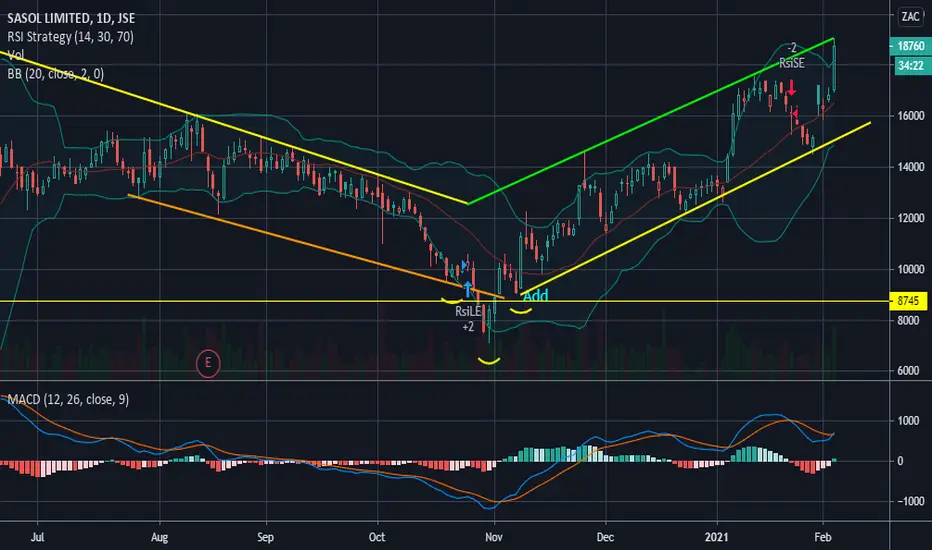
Sasol Analysis Sasol seems to be readying itself to cross that R180, 185 resistance line and it will all depend on the next earnings report due 1st of March. Sasol is forecasting earnings per share to soar, and oil prices seem due to break out again as they have been very tame lately. The uptrend (short term) continues until then and i have adjusted the uptrend support line to accommodate the trajectory. The next dip will be something worth buying into.

