SOLBE1 trade ideas
finally turning? - Waiting for hourly close above R436finally turning? - Waiting for hourly close above R436
Sasol – Running out of FuelIn one fail swoop, Sasol not only dropping 13% in one day, but also broke a very strong support line at R383.50. Main reason was the Lake Charles Project not only seriously going over budget, but also starting to look like the Never-Ending Story. Debt levels are becoming a serious concern and although the lowish PE multiple, the outlook still doesn’t look good.
$JSESOL now extremely oversold according to its 14-day RSI and also serious price underperformance relative to the FTSE/JSE All Share. Any person brave enough (not one of them) to go long in Sasol for a possible recovery, should watch that R357 support level. This will surely be my stop-loss if I were long.

Crazy Sasol tradeCall me crazy, but today's Sasol shocker provides an excellent trading opportunity. Today's "flash crash" has taken the price back down to a monster support level and I really think this is one for the punters. If fortune truly does favor the brave, then I should be just fine. I have bought this support level for a bounce back above R400.00 and I wouldn't be surprised if we saw R420.00 in the coming weeks. Given the information we have on the additional $1 Billion over-spend on the project, I think this morning's move is a MASSIVE over-reaction and many many forced sellers got hurt. Be brave and get back in

SASOL (SOL) 1-HOUR TIMEFRAME SHORTThis stock is moving in a downtrend, and the weekly timeframe shows a possible right shoulder forming. A break of the neckline on this weekly timeframe will signal further bearish momentum. On the 1-hour timeframe, price are trickling down as the momentary uptrend has finished and prices are below that ascending trendline, forming a series of lower highs and lower lows and also forming a series of bear flag patterns. My figures are as follows:
Entry: Now
Stop Loss:44 000
Target Take Profit: 40 000
Is it just a coincidence that the crude oil prices are also falling? We will never know.

Sasol ADR - Monitoring For A Long Term Downside Break Sasol ADR (NY): Taking a step back, I’m once again having a look at Sasol’s US listing. At current levels, the share trades just above a 3-year incline support that appears to be a part of bigger bear flag formation that had been in development since the share made a ‘final’ peak in September 2014. It should also be noted that the 200-month moving average, which acted as support from April 1999 to July 2015 is now serving as resistance. Holders of Sasol within a long term equity portfolio should monitor the share for break of support as this may signal a shift in trend from sideways to bearish.
NYSE:SSL

SOL - On Support level of handleSOL has reached the R440 Support - Retraction Confirmation here will indicate (CUP and Handle) handle downtrend STOP -----followed by an uptrend towards resistance to complete handle.
Breaking through R440 support level may lead to a fall towards next support of around R385.
Just hang in and then decide to go LONG or SHORT

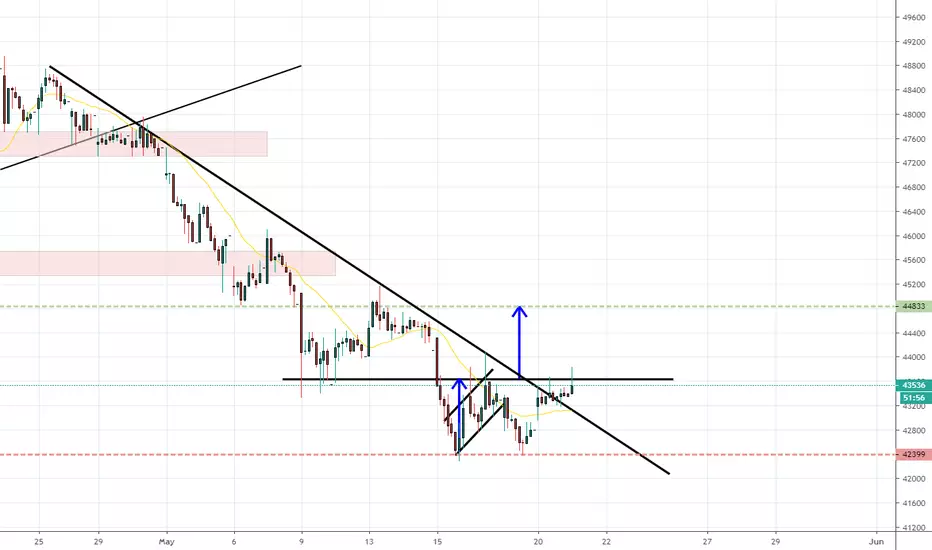
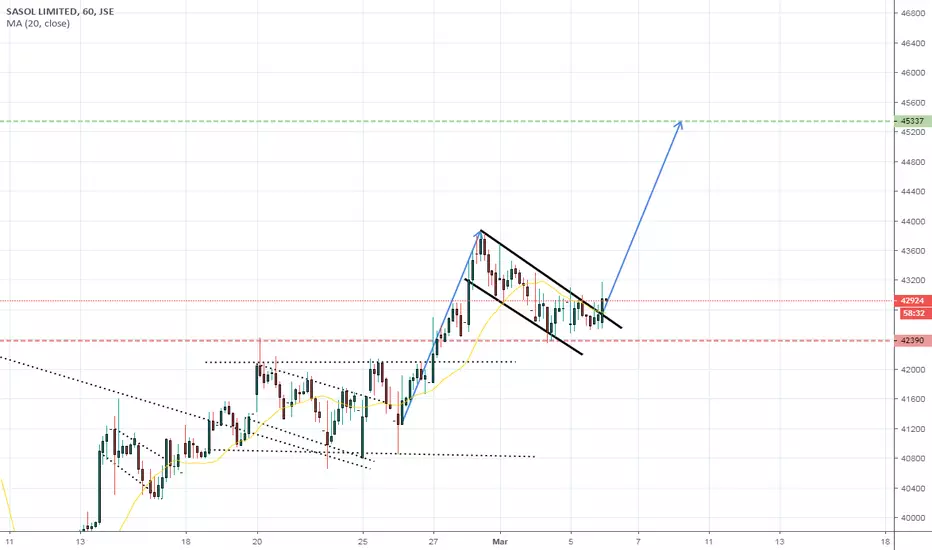
SASOL LTDSOL H4 (240 Minute) Timeframe
Reasons For Entry :
- Trendline Breakout
- Bullish Channel Breakout
- QML Target
Everything Good Yearns Patience And Time
Disclaimer: Trading stocks, commodities, futures and forex has a level of risk and may not be suitable for all investors.

Back in an accumulation zone - 20day MA providing nice SLBack in an accumulation zone - 20day MA providing nice SL

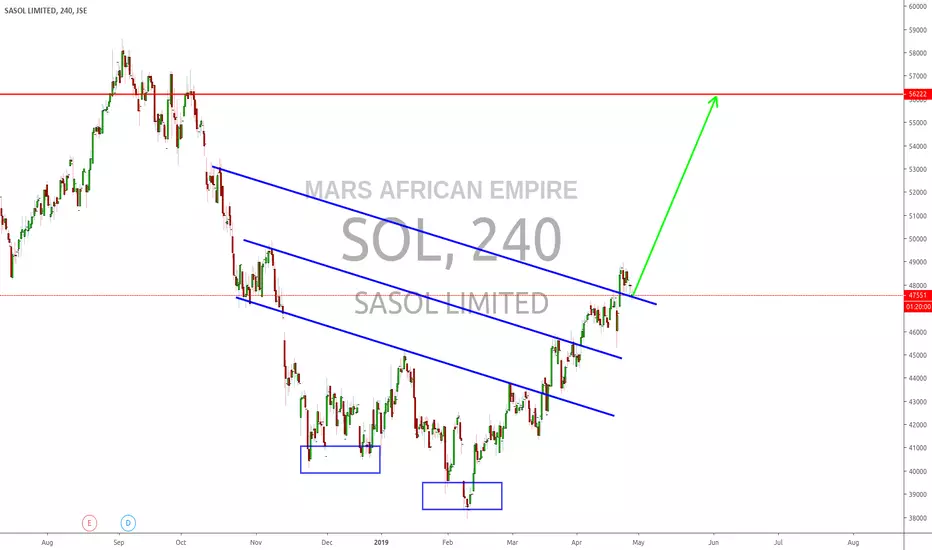
$SOL Breaking down from its bullish channel and losing 200 dmaSasol has broken down from the strong upward channel that has been in place since February of this year. In addition, it has also failed to make any progress above the 200 day moving average which makes this technical structure look very shaky. There is some strong support between R385-R400 should we get there in the weeks ahead which could potentially be a good opportunity to buy the stock once more.

SOL - Cup & HandleNice Cup formation here. Wait for handle formation.
SOL broke through R474.00 resistance level - new support.
Strong resistance at R493.00 to R494.00 - may start forming handle here and fall back a bit before upward trend of handle starts.

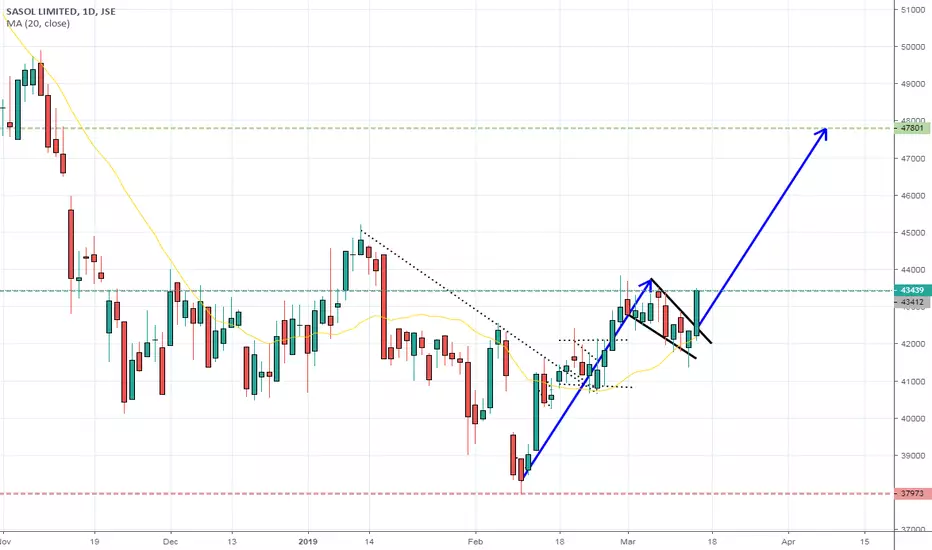
Bounce in the R434 region may offer new entry point Bounce in the R434 region may offer new entry point

Daily close above R434 key Bullish action continues - daily chart confirming hourly bullish signals. Close above R434 will be key. Target R478
SASOL LTDWait for the market to drop to the demand zone indicated with the red arrow facing up and buy there targeting the supply or FTR area

SASOL 1-HOUR TIMEFRAME NEUTRALThe stock price for SASOL is moving in an ascending channel, and my natural bias would be for a short position. However, it is always best to wait for price to show its hand before making any bets or predictions. It is still possible for prices to continue up as the general trend has been bullish.

JSE:SOL Sasol Breaking the Trading RangeSasol has formed a smaller Trading Range (TR). There has been a steady decline in volume indicating absorption. Divergence on the Volume RSI points towards accumulation. Price is approaching the Yearly Pivot Point and 200MA. If it jumps across this resistance we can see a markup but if it finds resistance we this could indicate distribution.

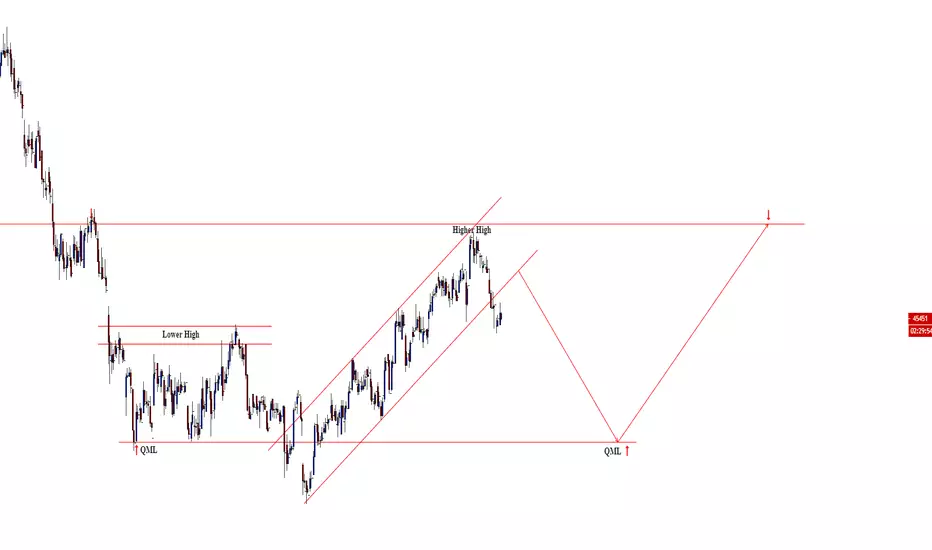
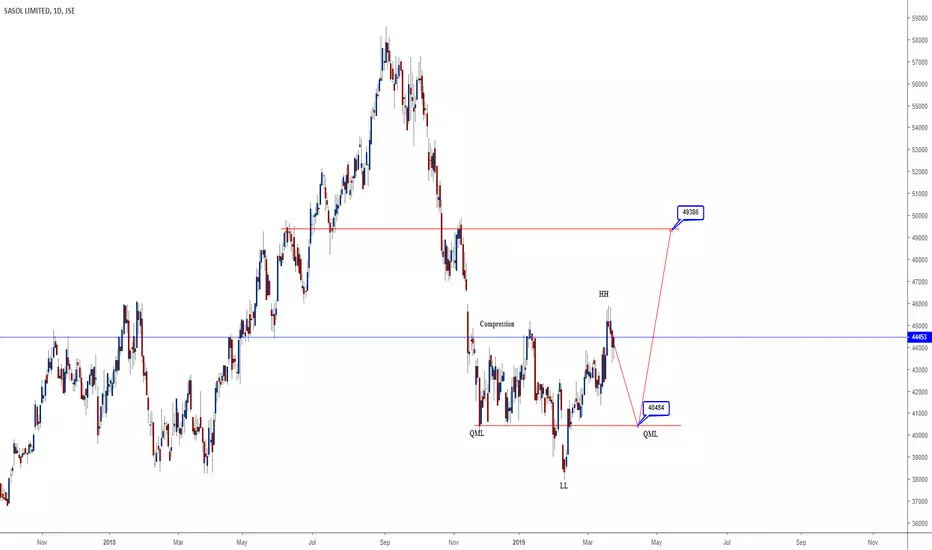
SASOL LTDOn SASOL, I foresee an unfolding Quasimodo pattern as it gave us the new high which on smaller Timeframe is around the supply zone. I expect it thus to drop a little towards the 40484 price range /area then take in the buyers up to the target at 49386

$JSE-SOLJSE:SOL
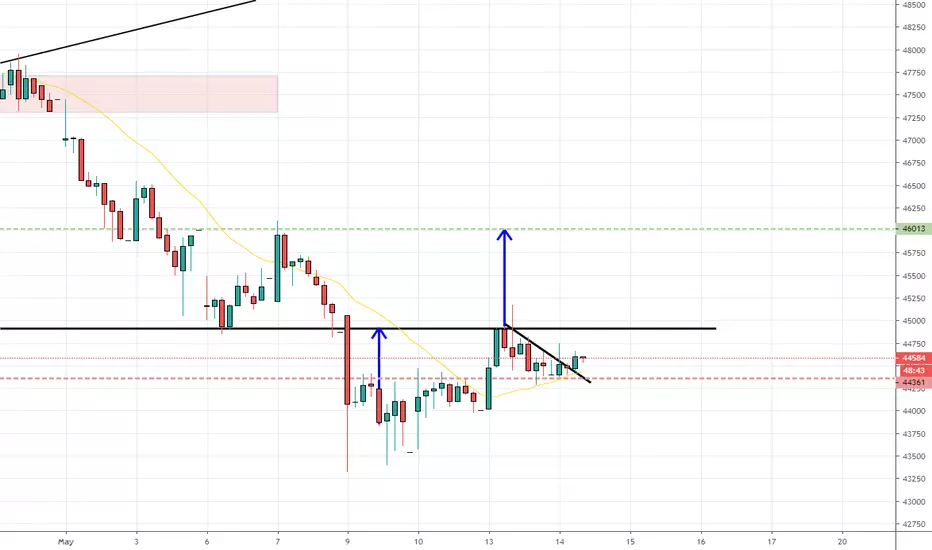
Pressing against 44000.
If it breaks higher (or should I say when) will go for gap close around 46500
First target is 45000

$JSE-SOLJSE:SOL
Had nice run over last few weeks but currently looks like it losing momentum.
Indicator made hidden divergences (Indicator makes higher high, price makes lower high)
Could be that Sasol is rolling over.
