Spar setting up for the next upside to R171.37 -SMC explainedCup & Handle formed on the Daily chart.
Price is only breaking above the brim level now.
This is good news for the bulls.
Other indicators showing upside.
7>21 >200
RSI>50
Target R171.37
SMC
Sell Side Liquidity Order Block is clear where there is buying from Smart Money.
ABOUT THE COMPANY
The Spar Group was founded in the Netherlands in 1932 and has since grown to become one of the largest retail and wholesale businesses in the world.
The company operates in four main regions: Africa, Europe, Asia-Pacific, and the Middle East.
As of 2021, the Spar Group operates over 13,800 stores worldwide, employing over 400,000 people.
There is even a Spar store in Greece in Athens...
The company's stores range from small convenience stores to large hypermarkets, and they offer a variety of products, including groceries, fresh produce, baked goods, and household items.
SPP trade ideas

Spar Group (SPP): Breaking OutSpar has been in a downtrend with price seeking a yearly low point. Now price has done the following:
1. Broken out of downtrend channel
2. Closed above the 30DMA & 200DMA
3. Price seeking to confirm a daily cycle low, favouring 28 February as the day
4. Price action exhibits some traits of stage analysis breakout, high volume to break the 30 week moving average albeit no big base for stage 1
Current price level is a good entry point, with a strict stop-loss at R141.50

Spar showing mixed signals but bullish bias to R160.11Spar has formed an Inverse Head and Shoulders
Since it hit our Short sell target, it's been forming the pattern.
However, as with most markets we are getting a bit of mixed signals.
7>21 <200 (Mixed)
RSI >50 Bullish but turning.
My target remains to be R160.11 but this is a medium probability trade.

SPAR - Testing 50 FibSpar has had a great rally from the December low where it presented much value.
It has now tested the 0.50 retrace level... 50% of it last major down leg.
The down sloping 200dma is currently around R146 (top of ambush zone)
Bulls may need to recharge at R130 - R133.50 zone and let the 20ema catchup.

$JSESPP - Spar Group: Is The Big Bear Finally Over?The last time i covered Spar was on 12 July 2022 and i forecasted buying potential at a key support zone.
Spar did catch a bid at R129,09 but that rally was short lived and proved to not be the bottom.
The share price was decimated on the 16 of November 2022 after the release of the annual results for FYE'2022.
The share price seems to found buyers at R112,98 and this has prompted a re-evaluation of the wave count from R213,47 back in February 2021.
The updated wave count implies that waves (1) to (5) are complete. For this view to remain valid, price must hold above R112,98.
Not one to chase momentum, i recommend waiting for a pullback or consolidation before joining the bulls.

Spar - Approaching supportSPP has been hard hit and negative sentiment in the news has not helped. Major support was initially broken at 136.13, then further minor support was broken at 128.94. Share is now approaching long term support at 106.12 but at current levels one could possibly start building a long position. Stop loss below 106.00.

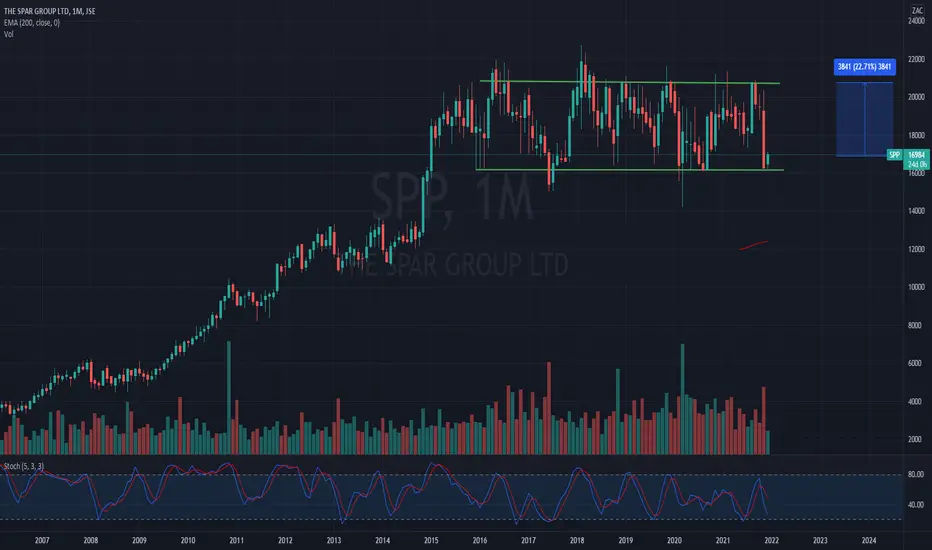
$JSESPP SPAR Group Ltd - Could SPAR Catch A Bid At Support ZoneSince peaking in February 2018 at 22700 zac, SPAR has retraced 40% but is hitting a critical support zone.
From an Elliott Wave perspective, the decline from the all-time high to the March 2020 covid-19 sell-off low at 14225 zac unfolded as an ABC zigzag for wave (A).
Wave (B) made a deep 88.6% Fibonacci retracement to peak at 21347 zac.
The current sell-off from 21347 zac seems to be unfolding in a textbook five wave impulse with wave 3 subdividing in a clear five waves, wave 4 does not overlap with wave 1 and wave 5 seems mature.
At this stage there is no price action evidence that a turn-around is imminent but price is trading at historical support/resistance in the 13484 to 10730 zac zone.
To create confluence, the 12872 to 10872 zac zone represents the price area where wave (C) is a 1.00 to 1.236 Fibonacci multiple of wave (A), a common ration for a (A)(B)(C) flat pattern.
Momentum is still clearly to the downside but this is a chart worth watching in the short-medium term.

SPP - 1D - SPARPossible buying opportunity on Spar with a pullback to top of downward channel, and waiting for formation of a bullish candle for a perfect goodbye kiss. MACD on weekly chart has crossed over, and momentum is to the top .We are also near a strong support coming all the way from 2012. They have recently also streamlined their Polish business, which will have a positive effect on their bottom line. First target of 12% to the upside then 17% then 30%.

SPP: perfect Elliott wave countIt appears that a perfect wave count is unfolding.
A corrective wave 3 is busy unfolding.
The 200-day might also act as major resistance.
This gives the opportunity of a buying opportunity of an accumulation close to the 14500 level.
This will give the lead to an impulse wave.

Spar Group - Target ReachedMy long idea on SPP has reached it's target of R150. This was an idea presented to clients on Monday at 13713c, with the full move being +1287 or +9.3% (ungeared).
For more research, including trade ideas, get in touch today.

SPPSpar Group (SPP) - triggered on strong bids at or around the trend change level. I also have two other trade ideas for today, one in the financial sector and the other in the mid-cap industrial sector. For more research, including trade ideas, get in touch today.

The Spar GroupThe next stop is around 98 bucks a share. Broke a more than 12 months consolidation.
If you like this idea Don't Forget to Follow me for more ideas like this.
Thank You!

Spar Group: Target Exceeded, ST ReduceOriginal Idea Attached.
Update: Target Exceeded, ST Reduce
Prior to today, the share held the PIVOT for 3 days, which is always our trigger.
Previous comment as follows:
Spar Group: BUY IDEA - Inverted Hammer Candle + Test of 0.618% Fibonacci Retracement Level. Buy/Long Pivot with trigger/confirmation level of 16897c.
LAST = 16666c
LONG PIVOT = 16897c
STOP-LOSS = 16567c
TARGET = 17400c
Original Idea Attached.

SPAR - MAJOR DOWNSIDE RISK#SPAR shareprice is showing great weakness:
Consolidation range
SPAR is currently trading within a multi year consolidation range (between white trend lines). However it is trading near the bottom end of this range, already showing some weakness.
Head & Shoulders
The purple line indicates the multi-year pattarn's neckline. If it breaks to the downside, this could spell disaster.

SPAR GROUP BROKE RESISTANCE LEVEL The Spar group has broken the resistance price zone and will most likely head towards the next high at 20802 price range.

Possible Long trade idea on $SPPPrice has historically traded within SR levels of 16200 - 21100. Price is oversold on weekly chart and has tested the SR level at 16200 and bounced. Looking to trade this range with LT target of 21100. Stock is also oversold. LT price trend is up. Always manage your risk
SPAR testing bottom range of channelSPAR bouncing off downward sloping channel trendline + strong horizontal support off the R162,00 level that ahs provided support many times in the last 12 months
reward to risk 1:2

AG Capital -Storm trading Morning Call 28 September 2021We give a quick recap of markets overnight and the previous day and insights into the day ahead with a few trade ideas on the day. Ideas are strictly NOT INVESTMENT ADVICE.

Spar Group: Long Target HitThought we would see a move lower, first, before higher however the share advancing immediately from publication date. Price now above long target level.
Original idea attached.

Trade Setup: Spar GroupUnrest in certain parts of South Africa has seen some retailers come under pressure. For some, such as Spar, the restrictions on alcohol have place additional pressure, with investor sentiment souring because of the uncertainty. At the current short term depressed levels or better it may be an opportunity to purchase these shares on the expectation that sentiment improves, and investor interest returns.
Trading Levels:
Buy SPP in the range of 17100 to 17450 (close to swing support)
Stop-loss: 16770c
Target Range: 18500c to 18800c

The Spar Group-UpdateH&S finally playing out after the choppy price action that followed after the initial neckline break (when I spotted and published the set up).
Price moving towards the 165 TP area.

SparI seem to be seeing H&S patterns on most charts these days!
Spar seem to be breaking the neckline of such a technical pattern today, as price attempts to close the November 2020 gap.

SPP - Support at R188SPP has bounced of R188 for the last couple of weeks and into R200. The range is still intact with a nice R:R on the trade, entry just above R188 with a stop loss at R187 while first target is R194 and full target at R200.
