$STX40 Satrix 40 ETF. Weekly inverted head and shoulders breakThis break on the weekly chart could indicate a target of 85 000 or 14% upside potential.
STX40 trade ideas

$STX40 Satrix Top 40. Inverted head and shouldersInverted head and shoulders on the weekly
This market is already up 10,44% for the year and looking at that inverted head and shoulders target of 85000, it does not look achievable for this year.
A 85 000 target will give a total return of 26% if achieved during 2024.
I'm cautiously optimistic. This is a wall of worry bull market.
A decent pullback in 2024 would not be unexpected.

Comparison of SA Top 40 vs the SWIX Index ETF'sComparison of SA Top 40 (using the Satrix 40) vs the SWIX Index ETF's clearly shows that over a 5yr period an investor would have better off sticking with the Top40.

Bearish Sentiment on Satrix Top 40Satrix Top 40
1. Price Formation: The price has broken out from an inverted Cup and Handle price formation on a daily chart.
2. Moving Averages: The 7-day moving average (MA) is below the 21-day MA, which is a sign indicating short-term bearish momentum.
3. 200-day Moving Average is above the Price.
4. Thus, Mas 7<21 < 200
5. Relative Strength Index (RSI): The RSI is <than 50, indicating bullish momentum and potential further upward movement.
6. Price Target: to the bottom of the channel at 57
The Satrix Top 40 is an Exchange Traded Fund (ETF) based in South Africa. ETFs are investment funds that are traded on stock exchanges, much like individual stocks. They are designed to track the performance of a specific index, sector, commodity, or asset.
In the case of the Satrix Top 40, the ETF is designed to replicate the performance of the FTSE/JSE Top 40 Index, which is composed of the 40 largest (by market capitalization) companies listed on the Johannesburg Stock Exchange (JSE). This includes a broad range of companies from various sectors.
By investing in the Satrix Top 40, an investor effectively gains exposure to the performance of these top 40 companies without having to buy shares in each individual company. The fund purchases the shares on behalf of its investors and manages the portfolio to ensure it continues to mirror the performance of the FTSE/JSE Top 40 Index.

Satrix Top 40 Aims for R80 Price Mark Satrix Top 40 Aims for R80 Price Mark
1. Price Formation: The price has broken out from a symmetrical triangle price formation on a daily chart.
2. Moving Averages: The 7-day moving average (MA) is above the 21-day MA, which is a positive sign indicating short-term bullish momentum.
3. 200-day Moving Average < Price.
4. Relative Strength Index (RSI): The RSI is greater than 50, indicating bullish momentum and potential further upward movement.
5. Price Target: R80
Satrix Top 40 – the ETF
The Satrix Top 40 is an Exchange Traded Fund (ETF) based in South Africa. ETFs are investment funds that are traded on stock exchanges, much like individual stocks. They are designed to track the performance of a specific index, sector, commodity, or asset.
In the case of the Satrix Top 40, the ETF is designed to replicate the performance of the FTSE/JSE Top 40 Index, which is composed of the 40 largest (by market capitalization) companies listed on the Johannesburg Stock Exchange (JSE). This includes a broad range of companies from various sectors.
By investing in the Satrix Top 40, an investor effectively gains exposure to the performance of these top 40 companies without having to buy shares in each individual company. The fund purchases the shares on behalf of its investors and manages the portfolio to ensure it continues to mirror the performance of the FTSE/JSE Top 40 Index.

STX40 (Satrix)South Africa Top 40
USD/ZAR = 18.88
Is there rain or sunshine up ahead?
Either way,
I'm slowly accumulating and adding the STX40 ETF to my Tax Free Savings Account (TFSA).
I have remained liquid and have finally started to buy on larger pullback days. I have started building my position with an average price of R69.63.
It has just touched the 200 day moving average - so lets see if it can hold, if not, then it could make its way down to the R63-R65 zone, where I'll be a strong buyer. If it doesn't fall down to those levels, then at least I've started to build a position on strong sell off days.
*Dividends are Tax free*

5yr Relative performance of SA40 vs Emerging and US Markets5yr Relative performance of SA40 vs Emerging, World and US Markets

YTD Relative performance of SA40 vs Emerging and US marketsRelative performance of SA40 vs Emerging, World and US markets

our market off to the racesOur market is off to the races. The top 40 had a beautiful breakout on Friday with a follow through today. Nice Ascending triangle breakout. with a target at 7650. I dont think the market will end there. I think the market will run even further

Better late than never - Santa RallyBetter late than never. Santa came in a late with the rally this year. Top40 looking well poised to take out the head on H&S completely invalidating the pattern. Putting risk fully on

Satrix top 40Looking at my chart the jse looks to be heading for a slight dip. The satrix chart shows that satrix has been in a channel going up forming a bearish flag. Currently the support was broken and satrix is in a downtrend, if this is not a fake out I think Satrix could find new support @R50/R47.

SATRIX 40 The Satrix 40 is currently in a short term downtrend on the weekly
We in oversold territory on the oscillators but i will only get excited if we print a close above 6250 .
Below 5500 remains the next big level of support.
-- MANAGE YOUR RISK - -
Disclaimer: All ideas are my opinion and should not be taken as financial advice.

TOP40 - Update On the 20 Dec i posted this chart showing and important trendline and area of interest for the top 40
We have since rallied almost 10% to the recent high. I will be watching to see if we form a consolidation here or pullback to the up sloping trendline.
Previous post in link below ...

TOP40 - Important trendline- Global markets have been selling off today with a global risk off vibe
- It will be important for the TOP 40 to hold this trendline and pivot so as to prevent further selling pressure
-- MANAGE YOUR RISK - -
Disclaimer: All ideas are my opinion and should not be taken as financial advice.

$STX40 Another flat top and another dropFlat top resistance and breakdown and looking at 53000 for support

STX40 Satrix 40 ETF Losing momentumAfter what looked like a bull flag breakout, the momentum faded and we're now back into that flag pattern. 5800 Level looks likely to be tested sometime soon before support is expected.

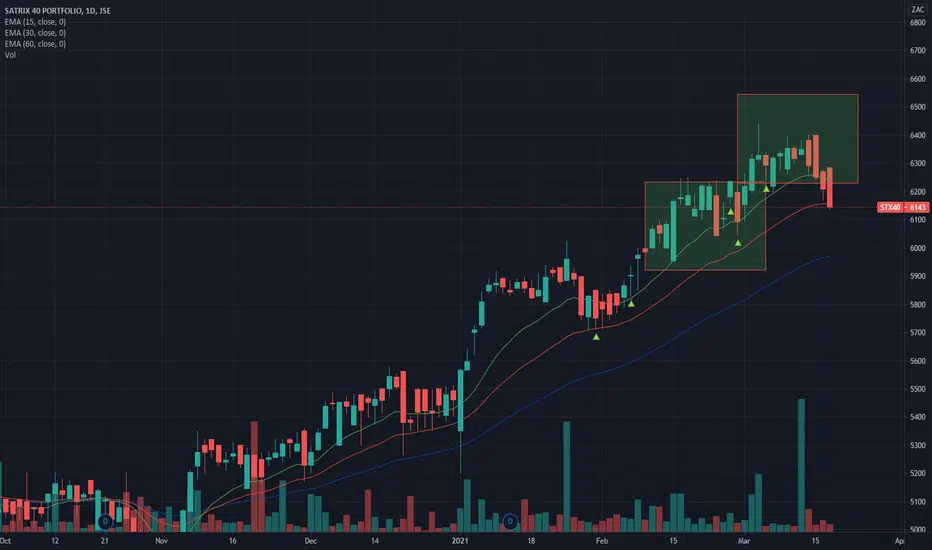
We have a buy trigger on Satrix 40 ETF #LazySystemWe have a buy trigger on STX40 as the ETF closes above the 15d EMA
We now waiting for the confirmation.
A close above
Subscribe to the Village Trader mailing list for email alert : eepurl.com

We have a buy trigger on Satrix 40 ETF #LazySystemWe have a buy trigger on STX40 as the ETF closes above the 15d EMA
We now waiting for the confirmation.
A close above 6227c
Subscribe to the Village Trader mailing list for email alert : eepurl.com
Visit VillageTrader.co.za

Lazy System Buy trigger confirms Village Trader Lazy System alert -
The buy trigger confirms
As the index closes above 6190c.
Going long market open.
For Lazy System email alert simply sign up to the Village Trader mailing list
eepurl.com
We've added S&P500 and Russel2000 ETFs to the alerts

The Lazy System buy trigger on STX40Village Trader Lazy System alert -
We have a buy trigger on STX40. Now we wait for the close above today's close 6190c
For Lazy System email alert simply sign up to the Village Trader mailing list
eepurl.com
We've added S&P500 and Russel2000 ETFs to the alerts

WE have a stop loss trigger on STX40We have a stop loss trigger on STX40 as the index closes below the 30d EMA . Exiting all positions first thing market open tomorrow morning
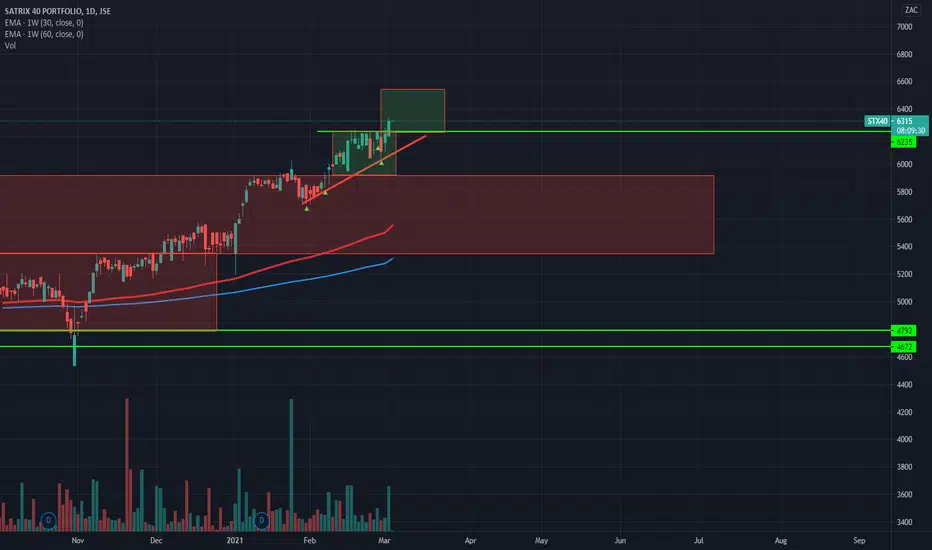
Satrix40 confirms the buy triggerSatrix 40 confirmed the buy trigger today as it closes above the R61.04
Stop loss, A close below the 60d EMA
If you wish to get email alerts on the lazy system sign up here: eepurl.com
