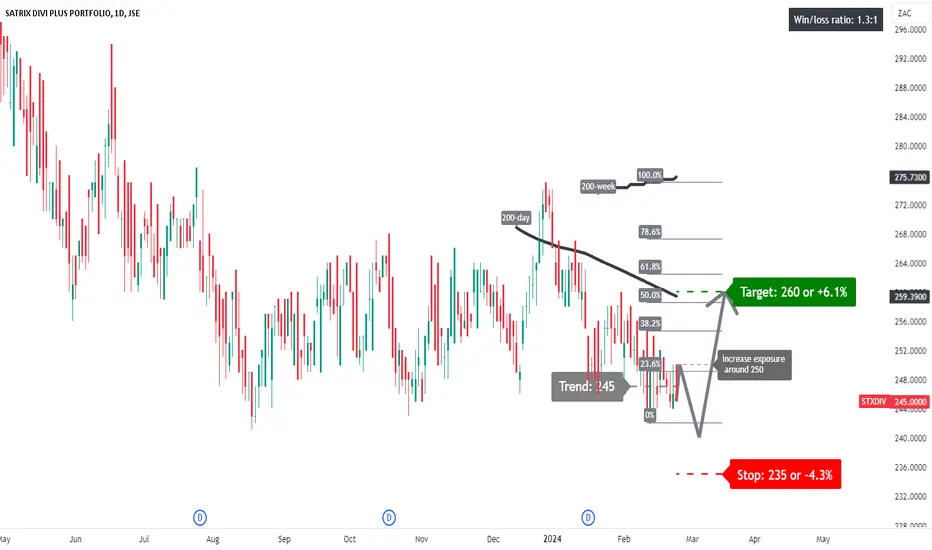
STXDIV: some muted upside potential?A price action above 245 supports a bullish trend direction.
Increase long exposure for a break above 250.
The target price is set at 260 (its 50% Fibonacci retracement level). This level is also at its 200-day simple moving average
The stop-loss is set at 235.
The consistent recovery in price movem
Key stats
About SATRIX DIVI PLUS PORTFOLIO
Home page
Inception date
Aug 29, 2007
Replication method
Physical
Dividend treatment
Distributes
Primary advisor
Satrix Managers (RF) Pty Ltd.
ISIN
ZAE000102018
The mandate of the Satrix Divi ETF (Satrix DIVI ) is to track, as closely as possible, the value of the FTSE/JSE Dividend Plus index (J259)
Classification
What's in the fund
Exposure type
Finance
Non-Energy Minerals
Retail Trade
Consumer Non-Durables
Stock breakdown by region
Top 10 holdings
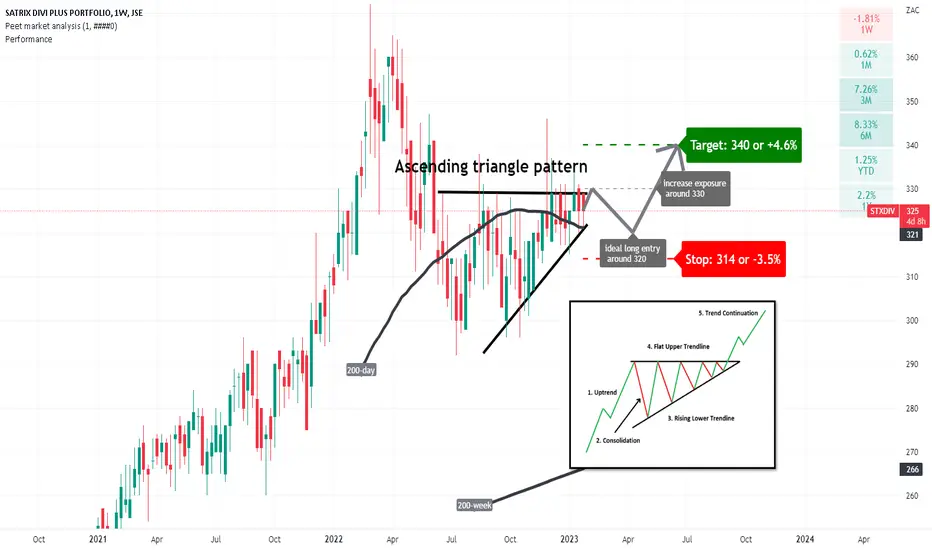
STXDIV: some upside?A bullish trend direction is applicable.
The ideal long entry price is around 320.
Increase exposure for a break above 330.
Profit target 340.
Stop-loss at 314.
The Ascending triangle pattern might assist the price action in some upside potential.
Time exit around the start of June 2023.
Remains jus
See all ideas
Summarizing what the indicators are suggesting.
Oscillators
Neutral
SellBuy
Strong sellStrong buy
Strong sellSellNeutralBuyStrong buy
Oscillators
Neutral
SellBuy
Strong sellStrong buy
Strong sellSellNeutralBuyStrong buy
Summary
Neutral
SellBuy
Strong sellStrong buy
Strong sellSellNeutralBuyStrong buy
Summary
Neutral
SellBuy
Strong sellStrong buy
Strong sellSellNeutralBuyStrong buy
Summary
Neutral
SellBuy
Strong sellStrong buy
Strong sellSellNeutralBuyStrong buy
Moving Averages
Neutral
SellBuy
Strong sellStrong buy
Strong sellSellNeutralBuyStrong buy
Moving Averages
Neutral
SellBuy
Strong sellStrong buy
Strong sellSellNeutralBuyStrong buy
Displays a symbol's price movements over previous years to identify recurring trends.
Related funds
Frequently Asked Questions
An exchange-traded fund (ETF) is a collection of assets (stocks, bonds, commodities, etc.) that track an underlying index and can be bought on an exchange like individual stocks.
STXDIV trades at 264 ZAC today, its price has fallen −1.14% in the past 24 hours. Track more dynamics on STXDIV price chart.
STXDIV net asset value is 2.62 today — it's risen 4.29% over the past month. NAV represents the total value of the fund's assets less liabilities and serves as a gauge of the fund's performance.
STXDIV assets under management is 1.62 B ZAC. AUM is an important metric as it reflects the fund's size and can serve as a gauge of how successful the fund is in attracting investors, which, in its turn, can influence decision-making.
STXDIV price has risen by 3.17% over the last month, and its yearly performance shows a 0.76% increase. See more dynamics on STXDIV price chart.
NAV returns, another gauge of an ETF dynamics, have risen by 4.29% over the last month, showed a 2.67% increase in three-month performance and has increased by 0.10% in a year.
NAV returns, another gauge of an ETF dynamics, have risen by 4.29% over the last month, showed a 2.67% increase in three-month performance and has increased by 0.10% in a year.
STXDIV fund flows account for −3.33 B ZAC (1 year). Many traders use this metric to get insight into investors' sentiment and evaluate whether it's time to buy or sell the fund.
Since ETFs work like an individual stock, they can be bought and sold on exchanges (e.g. NASDAQ, NYSE, EURONEXT). As it happens with stocks, you need to select a brokerage to access trading. Explore our list of available brokers to find the one to help execute your strategies. Don't forget to do your research before getting to trading. Explore ETFs metrics in our ETF screener to find a reliable opportunity.
STXDIV invests in stocks. See more details in our Analysis section.
STXDIV expense ratio is 0.41%. It's an important metric for helping traders understand the fund's operating costs relative to assets and how expensive it would be to hold the fund.
No, STXDIV isn't leveraged, meaning it doesn't use borrowings or financial derivatives to magnify the performance of the underlying assets or index it follows.
In some ways, ETFs are safe investments, but in a broader sense, they're not safer than any other asset, so it's crucial to analyze a fund before investing. But if your research gives a vague answer, you can always refer to technical analysis.
Today, STXDIV technical analysis shows the buy rating and its 1-week rating is buy. Since market conditions are prone to changes, it's worth looking a bit further into the future — according to the 1-month rating STXDIV shows the buy signal. See more of STXDIV technicals for a more comprehensive analysis.
Today, STXDIV technical analysis shows the buy rating and its 1-week rating is buy. Since market conditions are prone to changes, it's worth looking a bit further into the future — according to the 1-month rating STXDIV shows the buy signal. See more of STXDIV technicals for a more comprehensive analysis.
Yes, STXDIV pays dividends to its holders with the dividend yield of 3.20%.
STXDIV trades at a premium (0.55%).
Premium/discount to NAV expresses the difference between the ETF’s price and its NAV value. A positive percentage indicates a premium, meaning the ETF trades at a higher price than the calculated NAV. Conversely, a negative percentage indicates a discount, suggesting the ETF trades at a lower price than NAV.
Premium/discount to NAV expresses the difference between the ETF’s price and its NAV value. A positive percentage indicates a premium, meaning the ETF trades at a higher price than the calculated NAV. Conversely, a negative percentage indicates a discount, suggesting the ETF trades at a lower price than NAV.
STXDIV shares are issued by Sanlam Ltd.
STXDIV follows the FTSE/JSE Dividend Plus Index - ZAR - Benchmark TR Net. ETFs usually track some benchmark seeking to replicate its performance and guide asset selection and objectives.
The fund started trading on Aug 29, 2007.
The fund's management style is passive, meaning it's aiming to replicate the performance of the underlying index by holding assets in the same proportions as the index. The goal is to match the index's returns.