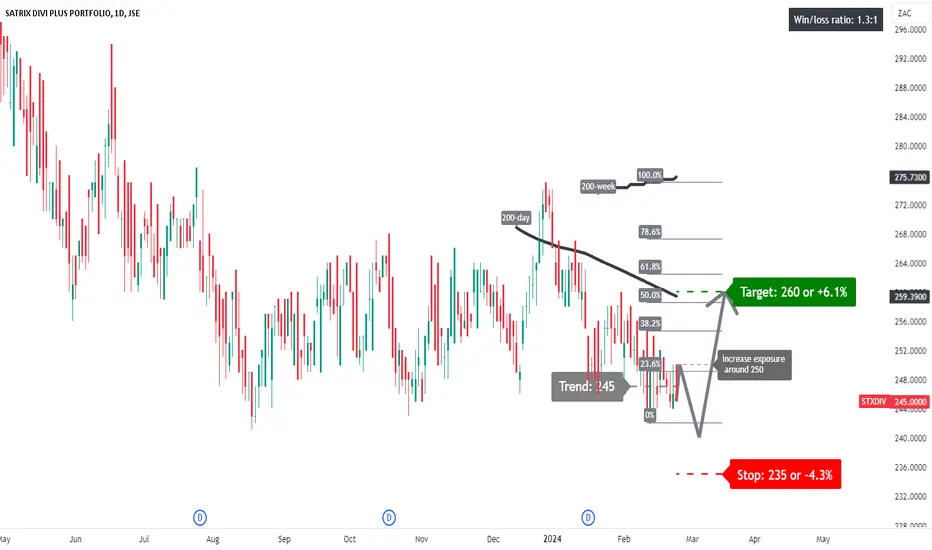
STXDIV: some muted upside potential?A price action above 245 supports a bullish trend direction.
Increase long exposure for a break above 250.
The target price is set at 260 (its 50% Fibonacci retracement level). This level is also at its 200-day simple moving average
The stop-loss is set at 235.
The consistent recovery in price movement makes this ETF a compelling choice for traders seeking opportunities.
STXDIV trade ideas
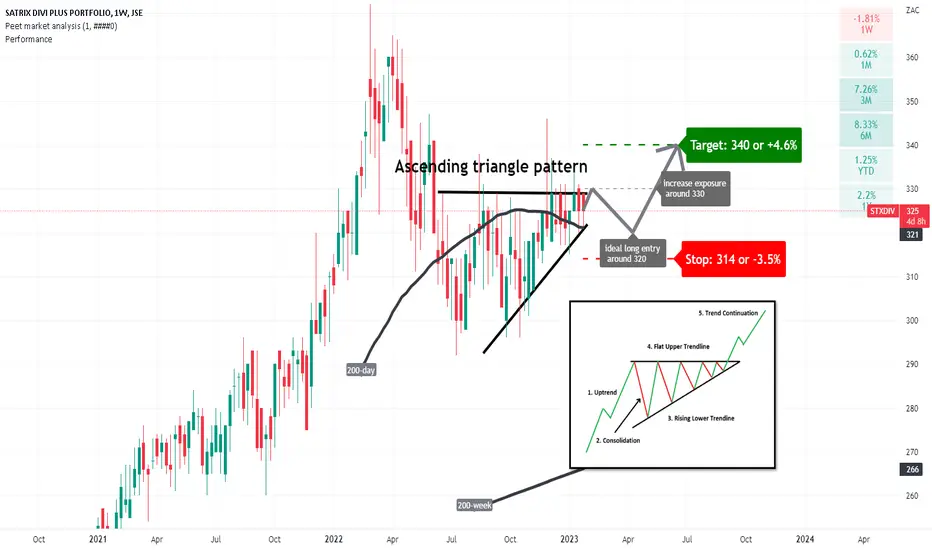
STXDIV: some upside?A bullish trend direction is applicable.
The ideal long entry price is around 320.
Increase exposure for a break above 330.
Profit target 340.
Stop-loss at 314.
The Ascending triangle pattern might assist the price action in some upside potential.
Time exit around the start of June 2023.
Remains just above its 200-day simple moving average, confirming a bullish trend.