TKG trade ideas

Another attempt!This one has been making me weight and turned just before my line in the sand. Good day today, want it to break this downtrend.

AG Capital -Storm trading Morning Call 25 August 2021 We give a quick recap of markets overnight and the previous day and insights into the day ahead with a few trade ideas on the day. Ideas are strictly NOT INVESTMENT ADVICE.


AG Capital -Storm trading Morning Call 19 August 2021 We give a quick recap of markets overnight and the previous day and insights into the day ahead with a few trade ideas on the day. Ideas are strictly NOT INVESTMENT ADVICE.

Bottom of ChannelTelkom at the bottom of positive channel, break would mean end of momentum, hoping channels holds.

AG Capital -Storm trading Morning Call 17 August 2021 We give a quick recap of markets overnight and the previous day and insights into the day ahead with a few trade ideas on the day. Ideas are strictly NOT INVESTMENT ADVICE.

TelkomIncline support breached, price approaching the last line of defense, the 200dma; up to it (200dma) to keep uptrend intact!


TKG - next stop either R38 or R50 JSE:TKG Don't you love the tension when a symbol gets to this point:
- MACD is at the signal line,
- RSI is at call it 50,
- The price is on the 5EMA which is on the 15EMA which is more or less on the 200DMA, and
- It's all at the tippety point of a symmetrical triangle
In its longer term trend I would've leant toward the triangle resolving upward to R50, but in the current negative SA news cycle (civil unrest, looting etc) perhaps it resolves down to R38 instead? Seems 50/50 from here
For what it's worth I'm long from R44.80 with extremely tight stops.
Happy trading
UC

TKG - Coming towards previous resistance at R44R44 was previous resistance and we have seen TKG going sideways for the past few sessions, a close above R45 triggers the long idea with a stop loss a close below R44 and full target at R48.


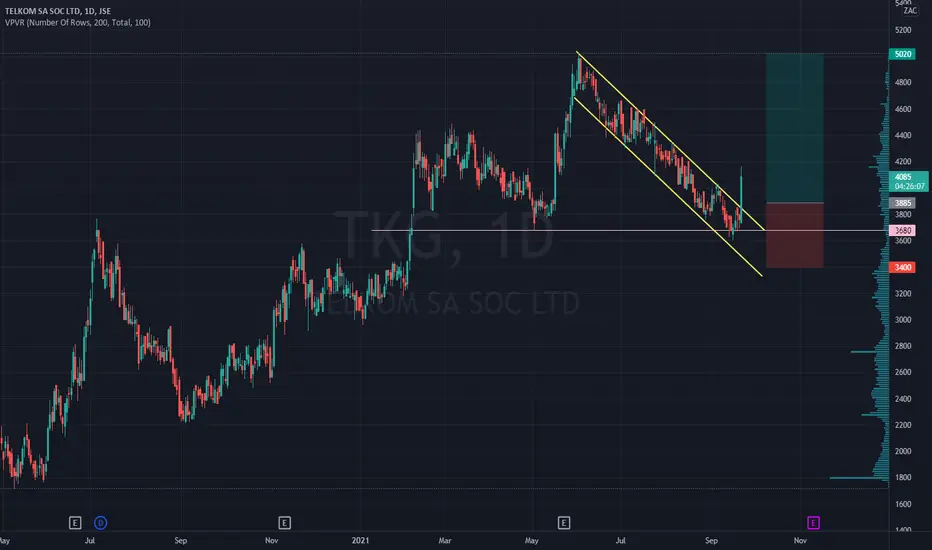
Long idea on TKGThe weekly chart shows the 3680 level as support for previous price action. Price needs a close above 5000 for sustained move higher in coming months or price hits the 4600 level and moves back down towards the 3680 or even lower to 3200. On the daily chart price has had a pullback and may be forming a bull flag / pennant for latecomers who missed entry in the previous breakout.

Long idea on TKGThe weekly chart shows the 3680 level as support for previous price action. Price needs a close above 5000 for sustained move higher in coming months or price hits the 4600 level and moves back down towards the 3680 or even lower to 3200. On the daily chart price has had a pullback and may be forming a bull flag/pennant for latecomers who missed entry in the previous breakout.

JSE:TKG Telkom MarkupTelkom is another stock starting to be marked up. Again the March 2020 lows were the trigger for the CO to start buying. Telkom has not made lower lows since then. There was a major sign of strength (SOS) from May to July 2020. Now we have seen a backup (BU) to a last point of support (LPS) and previous resistance. After a significant bar today we are looking for a break above recent highs and the markup to gain some momentum.


TKG Divergence on Weekly ChartDecent position trade looking like it might be up for grabs. Daily shows some decline still possible to test 2 standard deviations from the mean on the downside, still staying in the area of value for those believing the stock is cheap, but will hopefully move to test the 200 day MA and break above in the next couple of weeks. Targeting the 200 MA short term and the 6850c per share area of value after that.


Hoping for a move upwardsTelkom overall still in positive channel, indicators are signalling a possible move, monitoring this flag for a break.


TKG Daily in a 79 day consolidation boxTKG providing a good entry on the bullish trendline support
Risk reward 1:1.5

