AG Capital -Storm trading Morning Call 1 February 2022We give a quick recap of markets overnight and the previous day and insights into the day ahead with a few trade ideas on the day. Ideas are strictly NOT INVESTMENT ADVICE.
VOD trade ideas

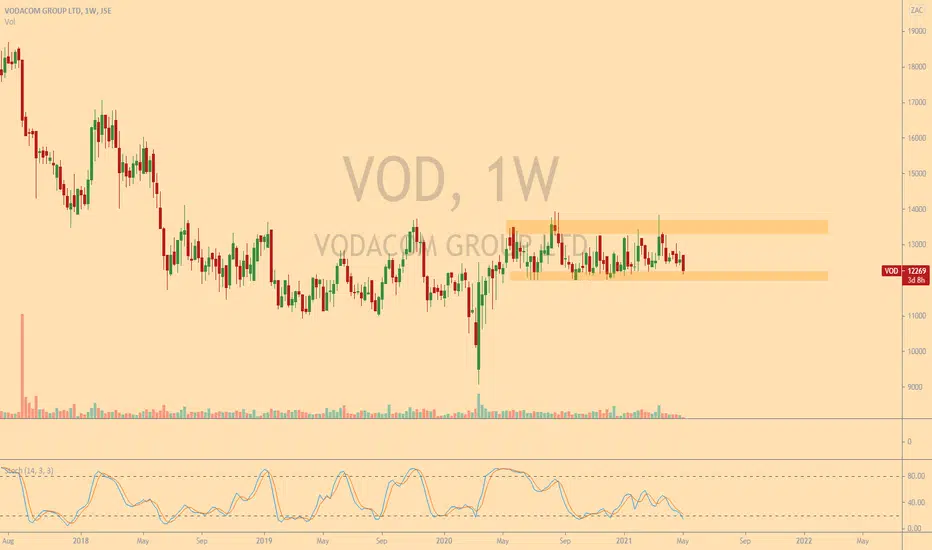
Long Pivot Level For Vodacom The attached pre-market chart and commentary has also been published to our client group. For more real-time insights and ideas, get in touch today.
Long Pivot: VOD
Key Trading Levels For Buy/Long Side Continuation
The highlighted levels may or may not trigger during the upcoming trading session.
Blue Line = Buy Trigger
Red Line = Temporary Failure
Required: Needs to hold around trigger zone with strong bids.
TF = Ultra Short Term, Short Term

$VOD possible long oppPrice has tested the EMA200 and bounced higher out of this pennant setup. A long pos can be in initiated here at 13550 decent trade with RR 1:3. As always manage your risk

Bullish Engulfing on VodacomA bullish engulfing candle has formed on JSE:VOD based on Friday's price action - it formed at a reasonably strong support level. The momentum indicators are all showing upward momentum so I think we could see a move towards the previous high at around 15100

Long idea on $VODThis bullish pennant price pattern finally playing out with a massive bullish engulfing candle. Price found support at the 13400 level and has bounced higher. Price may gap up at market open. Decent 1:3 RR in this trade with limit at 15000 level or the top off the pennant. As always manage your risk


Long idea on VODA bull flag setup here in VOD. The small gap has been closed at the 14200 level. Watch price to see if 14200 holds as level of support. Very decent R/R if you use ST limits with an entry at 14204 with Limit at 15000. Remember to always manage your risk

Hammer Harami on VODJSE:VOD formed a hammer candle on the 13th of September which also happens to form part of a bullish harami pattern. Both are strong bullish signals. I think we could see a move up to at least the previous high at around 14500. If it breaks through this level and confirms we could see a continuation to form even higher highs.

Long on VODPrice has broken out on the weekly chart and is targeting 14500 on the weekly and 14000 on the daily if you use short term targets. Possible support is at 13400 for hard pullbacks and softer pullback to 13707. As always manage your risk.

Vodacom-UpdateNice follow through on Vodacom, hitting highs above 137 during previous session.
Original idea posted on 1 July, see below.

Vodacom - Using data as a guide to capture intraday cashflowThe pivot to some form of automation is proving useful to a certain degree. My daily data isn't foolproof but merely acts as a guide. Data for end of day yesterday suggested VOD could overshoot the highs, and if it fails to hold, provide an opportunity to short/sell back to the 8-EMA. This is exactly what we saw this morning with the price selling off from above 13800c to above 13200c. If you managed to catch 70 to 80% of that, there may have been at least 450-500c up for grabs to generate intraday cash-flow.
For more, get in touch, today.


VodacomPrice attempting to break out of what looks like a bull flag structure; which break could take price to the 133-135 resistance area, an area buyers have failed to clear in the last 3 years!

VOD - Monthly Chart*An extract from my weekly report* 31 May - 04 June
"Vodacom Group | Equity Portfolio Perspective (via monthly Chart)| The share is heading for it's best monthly close since October 2019. The long term pivot level for the share remains 13318c where a close above this zone breaches a 3-year horizontal overhead supply opening up 14600c to 15400c over the medium term."
As noted a few weeks back Telecoms on a relative recovery vs the All Share Index (J203).

Pairs Trade Idea Update: Long VOD/Short TFG - Early ExitRe: Long VOD/Short TFG
I am slightly down on this pair this morning, with TFG being bid, possibly in part due to the MRP results.
Though the stop-loss has not been tested, traders should consider an early exit at a 4.6% loss.

Pairs Trade Idea: Long Vodacom/Short TFGTime Frame: Medium Term
I believe that on both a fundamental and technical level, this idea may be worth considering while also taking a market neutral approach. You could think of it as being 'long consumer staples' (or utilities) and 'short consumer discretionary' .
With talk of a 3rd 'covid wave' and murmurings by public officials, there is a risk that we could go into another lock-down, which could restrict movement and prohibit the sale of non-essential items. In that case, the need for communication services *should* increase (as remote activities become reinforced) while clothing stores *could* go shut shop temporarily.
Fundamental Features:
VOD
FY Revenue +8%
Operating profit (-0.2%)
Headline Earnings per Share (+3.7%)
EV/EBITDA 6.67x
Price/Earnings 13.6x
Price/Sales 2.25x
(Source: TradingView)
TFG
- Recent trading update suggesting strong recovery in Q4 2021, with group t/o growth of 21%.
Full year DHEPS -75% to -85%
EV/EBITDA 4.14x
Price/Earnings 19.3x
Price/Sales 0.94x
(Source: TradingView)
Performance over 1-Year:
TFG: +107%
VOD: 0.50%
Performance over 6-months:
TFG: +22.9%
VOD: -0.43%
Technicals:
The ratio price is threatening a channel break while the RSI is signaling a positive divergence. Also note the RSI lower time frames have shifted to a bullish regime. For conservative traders, a break of the channel would be your trigger.
Trade Levels:
Current: 1.07 (Ratio)
Entry Range: 1.06-1.08
Stop-loss: 0.96
Target Range: 1.24-1.28 (close to the 200-day SMA)
*Manage you own risk*

VODACOM(VOD) UPTRENDI am new to publishing ideas, but have been an avid trader for years and been on trading view for a couple of years doing technical analysis.
I thought to publish this idea as i believe there is a opportunity here.
VODACOM : reviewing the latest SENS news
Putting all the inflation (USA and RSA) worries aside(and waiting for the news to pass so investors can move the heck on!) , it seems from the great financials published recently and progress vodacom is making and new products/market they are entering, there is some positive movement here.
My reasoning :
DAILY CHART :
Currently it looks like it is in elliot wave 3.
The share has broken above it's 50 and 65 and 200 day SMA, although currently fluctuating above and below this level...
Fibb shows a potential to hit 38->62% fibb or even 62->76% , 78% fibb and it will be of great importance once it closes above the 38fibb off course, and the signs look good seeing its also above the SMA's mentioned earlier.
. Hopefully vodacom will hit R132-134 on Last day to trade (22june).
WEEKLY CHART :
If you view the weekly chart you can see the accumulation phase it is in.
It is also hovering at the 38fibb.
if it breaks R138.00 (above 38fibb) it will most probably run to the R150-R164 level (62 fibb and 76-78fibb) in the longer term.
Lets see how this unfolds.

VOD rangeVOD trading at the lower end of the range. As long as R120 holds i will look for targets between R130 & R135. Keep in mind VOD will release results soon.
VODACOM - Gearing up for next swing #JSEVOD- Price is still in a long term consolidation while the 200 day moving average is gradually moving up
- Looking for the next leg up towards the highs again
- Bull case in play while stay above R120
-- MANAGE YOUR RISK - -
Disclaimer: All ideas are my opinion and should not be taken as financial advice.


VOD - Coming towards support at R122VOD is approaching a big level of support at R122. Longs will be placed with a stop loss below R120 and target price of R130.

VOD sellerVOD have a big seller at the R129 level. When finished a visit to previous highs can be possible.
