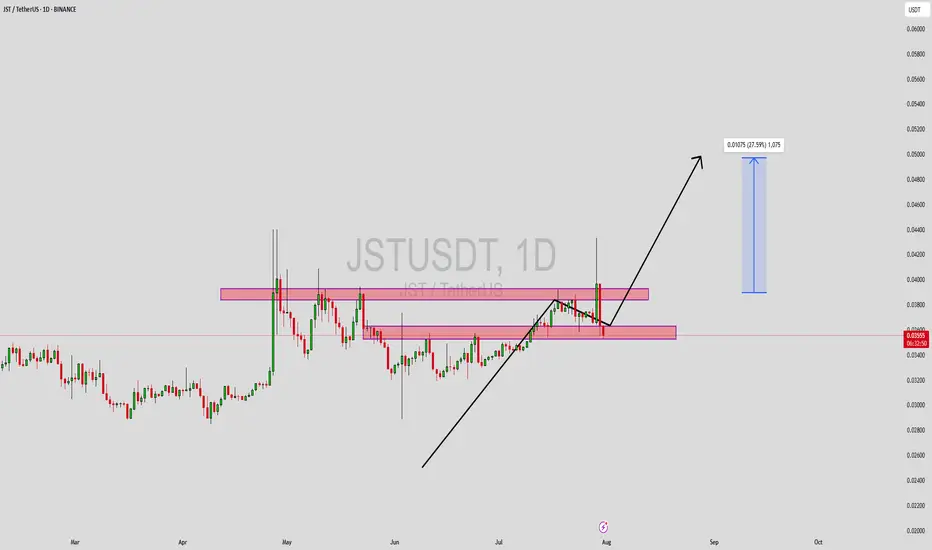
JSTUSDT Forming Bullish MomentumJSTUSDT has recently gained attention among traders as it moves closer to a key breakout level. The chart shows a series of higher lows, indicating underlying bullish momentum despite short-term rejections near resistance zones. The price action reflects a coiling structure with tightening price ran
Related pairs
JUSDT Short-Term Retrace vs Long-Term UptrendJST is not trading at bottom prices because the low was hit November 2022, but the bigger picture still looks like a long-term consolidation pattern. Sideways for years, this precedes a major bull market.
Good morning my fellow Cryptocurrency trader, I hope you are having a wonderful day.
JSTUSDT

JSTUSDT – Long-term Spot Buy Recommendation (2025)JSTUSDT – Long-term Spot Buy Recommendation (2025)
Context: The altcoin market has been bottoming out relentlessly since 2023. JST is no exception.
Out of thousands of tokens, why JST?
Because JST has just triggered a confirmed bottom signal this week, making it a prime candidate to buy.

JSTUSDT Forming Bullish WaveJSTUSDT is exhibiting a classic bullish wave pattern, signaling the potential for a trend reversal and a significant upward price movement. Recent price action suggests a solid base has been formed, with higher lows indicating growing buying pressure. As volume picks up, this adds weight to the bull
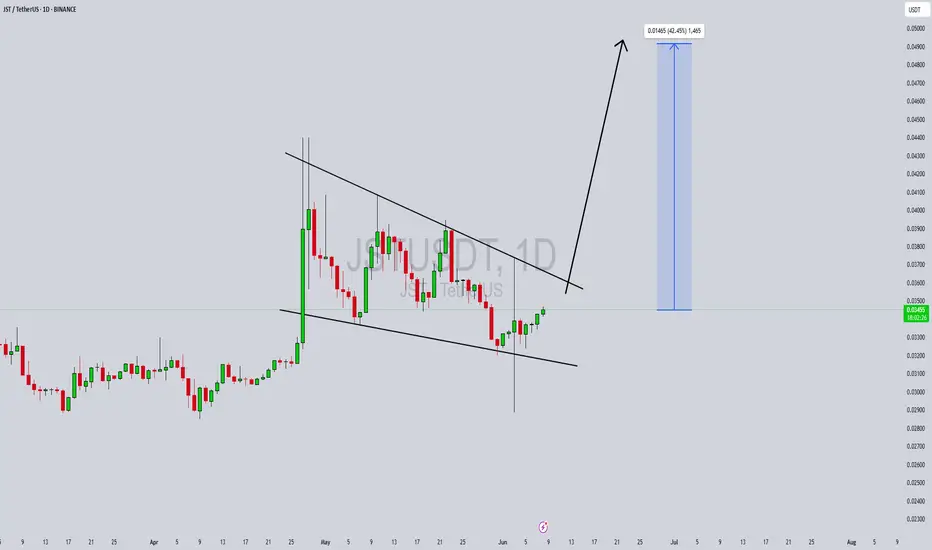
JSTUSDT 12H#JST is moving inside a symmetrical triangle pattern on the 12H timeframe.
To maintain bullish momentum, it must hold above the 12H EMA50. A breakout above the triangle resistance could trigger the next leg up.
In case of a breakout, the targets are:
🎯 $0.04140
🎯 $0.04323
🎯 $0.04583
🎯 $0.04915
⚠️

JUST x20 in 20251. DWF Labs made the first purchase with their new altcoin wallets. Justin Sun's #JST token has been purchased
2. On April 28, Sun stated that he believes that JST will become a 100x token.
3. Justin Sun knows how to make pumps. This is bullish

JSTUSDT (1D) - Technical Analysis & Trade Setup📌 Market Overview:
The price has been in a downtrend, forming a descending channel.
Currently trading near 0.03135, with 0.03718 acting as a key resistance.
A bullish breakout from the descending channel appears to be forming.
RSI breakout above trendline resistance suggests increasing bullish mo

JST 4H local trendthe price is trapped in a descending channel - a reversal will be from the current or through the formation of wave 335, which is unlikely

JST new trendThe intermediate 1/2 is almost formed
The correction option is either 333 or 335
In the case of 333, the reversal occurs from the current values.
In the case of 335, a reversal will occur at the marks of wave 4 of the secondary cycle.

$JST - Squeeze Pocket ActivatedBINANCE:JSTUSDT - Entering the 2nd phase of the squeeze, The first upside in the pocket wasn't very substantial. The second one is likely going to be a huge substantial move. Seems the overall public may not be showing too much interest in this coin, but that's exactly when all the real action take

See all ideas
Summarizing what the indicators are suggesting.
Oscillators
Neutral
SellBuy
Strong sellStrong buy
Strong sellSellNeutralBuyStrong buy
Oscillators
Neutral
SellBuy
Strong sellStrong buy
Strong sellSellNeutralBuyStrong buy
Summary
Neutral
SellBuy
Strong sellStrong buy
Strong sellSellNeutralBuyStrong buy
Summary
Neutral
SellBuy
Strong sellStrong buy
Strong sellSellNeutralBuyStrong buy
Summary
Neutral
SellBuy
Strong sellStrong buy
Strong sellSellNeutralBuyStrong buy
Moving Averages
Neutral
SellBuy
Strong sellStrong buy
Strong sellSellNeutralBuyStrong buy
Moving Averages
Neutral
SellBuy
Strong sellStrong buy
Strong sellSellNeutralBuyStrong buy
Displays a symbol's price movements over previous years to identify recurring trends.
Frequently Asked Questions
The current price of JST / UST (JST) is 0.03262300 USDT — it has fallen −1.87% in the past 24 hours. Try placing this info into the context by checking out what coins are also gaining and losing at the moment and seeing JST price chart.
JST / UST price has fallen by −10.42% over the last week, its month performance shows a −2.00% decrease, and as for the last year, JST / UST has increased by 20.04%. See more dynamics on JST price chart.
Keep track of coins' changes with our Crypto Coins Heatmap.
Keep track of coins' changes with our Crypto Coins Heatmap.
JST / UST (JST) reached its highest price on Apr 5, 2021 — it amounted to 0.19790000 USDT. Find more insights on the JST price chart.
See the list of crypto gainers and choose what best fits your strategy.
See the list of crypto gainers and choose what best fits your strategy.
JST / UST (JST) reached the lowest price of 0.01751700 USDT on Nov 5, 2020. View more JST / UST dynamics on the price chart.
See the list of crypto losers to find unexpected opportunities.
See the list of crypto losers to find unexpected opportunities.
The safest choice when buying JST is to go to a well-known crypto exchange. Some of the popular names are Binance, Coinbase, Kraken. But you'll have to find a reliable broker and create an account first. You can trade JST right from TradingView charts — just choose a broker and connect to your account.
Crypto markets are famous for their volatility, so one should study all the available stats before adding crypto assets to their portfolio. Very often it's technical analysis that comes in handy. We prepared technical ratings for JST / UST (JST): today its technical analysis shows the strong sell signal, and according to the 1 week rating JST shows the sell signal. And you'd better dig deeper and study 1 month rating too — it's sell. Find inspiration in JST / UST trading ideas and keep track of what's moving crypto markets with our crypto news feed.
JST / UST (JST) is just as reliable as any other crypto asset — this corner of the world market is highly volatile. Today, for instance, JST / UST is estimated as 3.87% volatile. The only thing it means is that you must prepare and examine all available information before making a decision. And if you're not sure about JST / UST, you can find more inspiration in our curated watchlists.
You can discuss JST / UST (JST) with other users in our public chats, Minds or in the comments to Ideas.