JST/USDTObserving this coin JUST ( XETR:JST ) for a while now, I'm quite fond of its technical structure. We're attempting to break through this global level and establish ourselves above it; all technical indicators suggest it's poised to do so.
JSTUST trade ideas
$JST SHORTthis is my opinion on XETR:JST
Support level is getting weak.
Its slready broaken in low time frames.

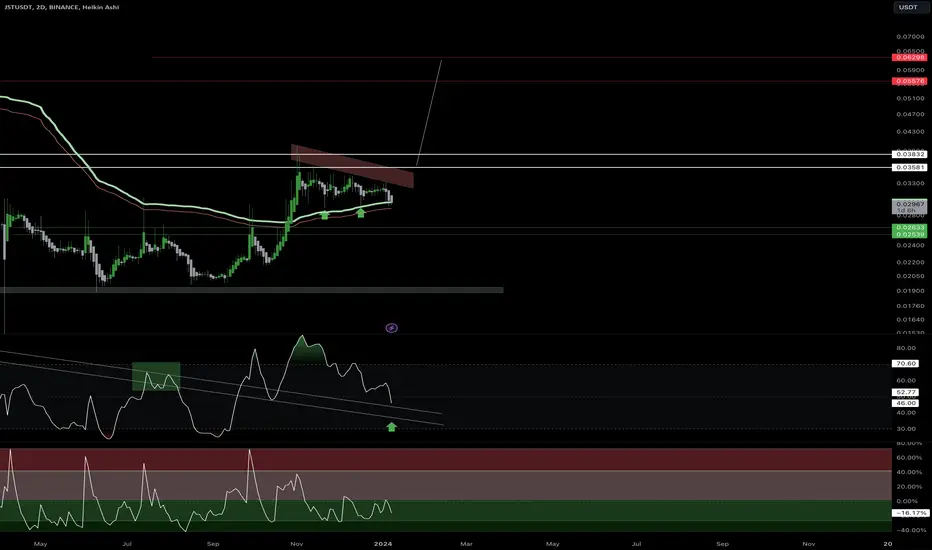
#JSTUSDTCurrency analysis #JSTUSDT time form 4 hours
The currency is just between two supply and demand ranges and a descending channel with a low slope. By breaking the yellow trend line and breaking the $0.034 resistance, it enters the upward phase and the targets of 0.036 and 0.038 are achievable. Pay attention to the green support lines as well. If the Demon area breaks and the channel breaks, we will go to lower levels.

JST/USDT Potential Breakout ahead ? 👀 🚀 JST Today analysis💎 Paradisers, prepare for a potential trading opportunity with JSTUSDT. Our analysis indicates a near breakout from its descending channel, suggesting a bullish move might be on the horizon.
💎 JST has been following a descending channel for a while, but it now appears poised for a breakout. A successful move above the channel could lead to breaking through the resistance level at .03551, opening the path towards stronger resistance levels.
💎 Presently, JST is trading in a demand zone, maintaining strong momentum above the EMA 100. However, if the price fails to maintain its upward momentum and breaks below this demand zone, we might see a shift towards bullish continuation from the support level. A break below this support could lead to a significant downward movement.

Justin JUST Foundation BULLISH WEEKLY JST looks very bullish on a weekly time frame.
What this means? this may be a very good news for Alts..
In the previous bull cycles JST was among the first to recover and ..
However on this chart .. this is the first weekly buy signal recorded.
Not an advice to get into JST right now as it is very over-extended.
Is must be a nice day for the holders of this coin.
And in the same time is good for the alt-coin market.
MORE ABOUT THE PROJECT - BELLOW -
What Is JUST (JST)?
JUST is a popular new decentralized finance (DeFi) ecosystem built for the TRON blockchain. It is an entire suite of products that are mostly centered around a decentralized stablecoin lending platform known as JustStable.
The platform launched in August 2020 following an initial exchange offering (IEO) on the Poloniex LaunchBase platform earlier that same year, but the native governance token of the platform (JST) has been circulating since May 2020.
It is a two-token ecosystem built around the USDJ and JUST (JST) tokens. USDJ is a multi-collateral stablecoin that has its value pegged to the value of the US dollar (USD), whereas JST has a variety of functions on the platform — paying interest, helping maintain the platform and participating in its governance, helping to set parameters like interest rates (stability fees) and the minimum collateralization ratio.
To obtain USDJ on JUST, traders need to deposit collateral in the form of supported collateral tokens — including TRON (TRX), which are exchanged to PTRX tokens and locked as collateral forming a collateralized debt position (CDP). Depending on the amount of collateral deposited, users can then mint and withdraw USDJ, which must later be repaid to retrieve the initial collateral.
The platform is designed to provide a fair and borderless hub of DeFi products, that any TRON user can access.
Who Are the Founders of JUST?
The JUST ecosystem is managed by the JUST Foundation, which includes individuals from Alibaba, Tencent, IBM and "other world-class internet companies," while JUST's financial analysis team hails from "several global investment banks" according to the project website.
Some of the most prominent individuals include Terance F (a blockchain expert and ex-Barclays and IBM employee), Elvis Zhang (a senior developer and experienced blockchain researcher), C Wu (a specialist in wallets and exchanges) and GL Kong (an experienced blockchain engineer and early crypto adopter).
The full names and profiles of much of the JUST team is not public. However, it appears that the project shares some overlap with the TRON development team, since the platform was announced by TRON CEO and founder Justin Sun, and has received technical and financial support from TRON.

jst on verge of massive breakout seems like getting ready for massive breakout formed text book symmetrical triangle in 3 days tf now testing multi year descending trendline trend line has already tested many times probably weak trend line and expecting breakout soon
incase of successful breakout expecting 220 to 240% bullish rally

JUST (JST) formed bullish BAT for upto 28.50% pumpHi dear friends, hope you are well and welcome to the new trade setup of JUST (JST) token with US Dollar pair.
Previously we caught more than 15% pump of JST as below:
On a 4-hr time frame, WAXP has formed a bullish Cypher move for the next pump.
Now on a 4-hr time frame, JST has almost completed a bullish BAT for the next price reversal.
Note: Above idea is for educational purpose only. It is advised to diversify and strictly follow the stop loss, and don't get stuck with trade.

Parabolic Short JST USDTOKX:JSTUSDT.P Parabolic Short. I'm expecting this price not beign sustained for the next days. I'm shorting it and giving a Stop Loss at 10 % the current price because most probably will pump a bit more.

JUST showing a very good investment opportunityHi Everyone;
today we have one of the best risk to reward Investment opportunity
it is more than 1000 times the risk and the chart is look very promising.

$JST Opportunity to rebound intraday!
BINANCE:JSTUSDT offers a great opportunity for intraday rebound. Pay attention to the horizontal lines above and below in the chart, which are the predictable stop-loss and take-profit price positions.

JST/USDT bullish move incoming 👀 🚀JUST Today Analysis💎 JST is on the brink of a breakout from a descending channel pattern, setting up for potential bullish momentum.
💎 Demand Zone: Currently, it's trading within a high-demand area, and the RSI is above 50, further reinforcing the bullish outlook.
💎 Another key factor is that it's maintaining strong momentum above the 50-day Exponential Moving Average (EMA).
💎 It's holding firm at a crucial support level of 0.01960. If the price breaks this support, it enters an invalidation zone where a significant downward move could occur.
💎In the dynamic world of crypto, staying informed and adaptable is key. Stay tuned for more updates and enjoy your trading journey

jst/usdt long R/R=4.3price back to important zone then it has a potential upward movement, by concidering risk of 1.8 % it is resonable to open this position.

JSTUSDT Short-Term Price PredictionsIntroduction: We present an in-depth analysis of JSTUSDT, a cryptocurrency that has garnered attention with a staggering 24-hour volume change of 1993.10%. Join us as we delve into potential short-term price movements and a comprehensive trade setup for JST.
Pattern Analysis: Our examination of the daily chart reveals a compelling descending triangle pattern, often indicative of an imminent breakout. Stay tuned for confirmation of this pattern as it unfolds.
Trade Setup: Explore a buy opportunity at 0.02341, targeting a price of 0.03807. Implement a stop loss at 0.0219 to effectively manage risk. This trade offers an appealing risk-reward ratio of approximately 9.5.

Jst Getting Ready For Massive recovery Seems Like Has already bottomed out Breaking Falling Wedge In 3days timeframe Incase Of successful breakout expecting 250%+ bullish wave in Midterm

JSTUSDT Possible 130% ProfitIf it breaks out of the top line it has the potential to go up at least 100%

#JST/USDT - Long - Potential 8%Direction: Long
Market: Spot
Risk: 0.25% - 1%
#USDT_JST
Exchange: BINANCE
Timeframe: 360
TP1: 0.02944
Entry: 0.02723
STOP: 0.02502
Entry Conditions:
| 200MA break
| Volume
| Consolidation break

#JST/USDT - Long - Potential 6.37%Direction: Long
Market: Spot
Risk: 0.25% - 1%
#USDT_JST
Exchange: BINANCE
Timeframe: 360
TP1: 0.03057
Entry: 0.02869
STOP: 0.02681
Entry Conditions:
| Trend Break
| Resistance Break

JSTUSDT long setup JST is pushing to break its trend for third time,
I expect a major trend reversal after confirmation of break out
its BTC pair also reacted on very strong support level
Tps and SL are marked on chart
Lets see

JST LONG SETUPHi, dear traders. how are you ? Today we have a viewpoint to BUY/LONG the JST symbol.
For risk management, please don't forget stop loss and capital management
When we reach the first target, save some profit and then change the stop to entry
Comment if you have any questions
Thank You

jst possible short ideaHUOBI:JSTUSDT
target at the lows @ 0.24
if weakness is still intact could reach 0.20 and 0.17


JUST (JST) formed bullish Gartley for upto 22.50% pumpHi dear friends, hope you are well and welcome to the new trade setup of JUST (JST) token with US Dollar pair.
Previously we caught a nice pump of JST:
Now on a daily time frame, JST has formed a bullish Gartley move. Right now, after the completion of the final leg the priceline is slightly moved up, therefore, we can wait for some price correction to catch it from the buying zone.
Note: Above idea is for educational purpose only. It is advised to diversify and strictly follow the stop loss, and don't get stuck with trade

JST looks good with new 3D candleit is quite nice setup close to the bottom... if btc stays stable we can see few % to the upside...
MANAGE YOUR RISK
NOT A FINANCIAL ADVICE
