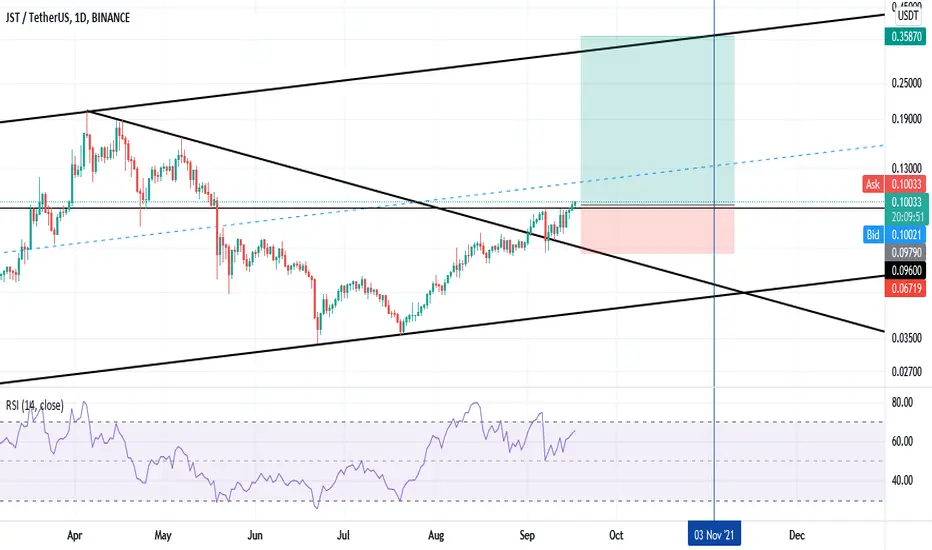
JST Zigzag Ending Now, Target $1-20 (Neowave/Elliottwave)JST looks like it has formed into a perfect Neowave Zigzag. Wave-b is a perfect irregular flat, wave-c is shorter in price and more complex than wave-a, and equal to exactly 50% of a+b in time. The Large Wave-B is related to 161.8% of wave-A in time. In the shorter term wave-5 of c is related to 50% of 3+4. All time targets are being hit here at the same time this week and momentum on virtually all time frames is bullish so I think we'll see something pretty big happening very soon.
Just going back to ATH would be a 1000% gain for JST, but if this is the beginning of a larger bull run as most other charts suggest then we could see prices at a minimum over $1 and probably as high as $20 over the next year.
JSTUST trade ideas


JST Falling Wedge Breakout 1Day ChartFalling Wedge has broken through the resistance line on Jun 25, 0:00 UTC. Possible bullish price movement forecast for the next 26 days towards 0.0605.

JUST (JST) - June 9hello?
Traders, welcome.
By "following", you can always get new information quickly.
Please also click "Like".
Have a good day.
-------------------------------------
(JSTUSDT 1W chart)
Below 0.04483 is likely to be a mid- to long-term investment area.
So, whether it can move higher than 0.04483 is the key.
From a mid- to long-term perspective, it needs to rise above 0.05873 to continue the uptrend.
(1D chart)
The key is whether it can find support at the 0.04082-0.04187 zone and move above 0.04483.
In the short-term and medium-term perspective, it needs to rise above 0.04483 and find support to turn into an uptrend.
(buy)
- After confirming the support at 0.04483
(Stop Loss)
- When resistance falls below the 0.04082-0.04187 section
(Sell)
- When receiving resistance near 0.05336
- When resistance is received in the range of 0.06858-0.07448
If it rises above 0.07962, it is expected to surge.
------------------------------------------------------------ -------------------------------------------
** All indicators are lagging indicators.
Therefore, it is important to be aware that the indicator will move accordingly as price and volume move.
However, for the sake of convenience, we are talking in reverse for the interpretation of the indicator.
** The MRHAB-T indicator used in the chart is an indicator of our channel that has not been released yet.
** The OBV indicator was re-created by applying a formula to the DepthHouse Trading indicator, an indicator disclosed by oh92. (Thanks for this.)
** Support or resistance is based on the closing price of the 1D chart.
** All descriptions are for reference only and do not guarantee a profit or loss in investment.
(Short-term Stop Loss can be said to be a point where profit and loss can be preserved or additional entry can be made through split trading. It is a short-term investment perspective.)
---------------------------------

[ALTCOIN] JSTUSDT TREND LINE ANALYSISHello, everyone
We're a team that specializes in chart analysis
We will always analyze and provide you with charts to help you sell
There are so many trading laws and there are so many good technologies that come with them, but I'm confident that the trend line is really strong.
If you read the point of view and get to know the line, every line will adjust
Thank you.
------------------------------------------------------------------------------------------------
Chart Analysis Content -
The rebound is coming from the best point of decline and rising along the blue line, a sharp upward trend.
Safe trading is when you go up on the thick yellow and test it, and before that, you draw a lot of blue and yellow lines at the same angle, so short-term trading will be advantageous.
If further falls break the green support line, it will go down to the sky blue downward trend immediately below.

JUST (JST) - May 11hello?
Traders, welcome.
If you "follow", you can always get new information quickly.
Please also click "Like".
Have a nice day.
-------------------------------------
(JSTUSDT 1W chart)
If the 0.04187-0.07448 section continues to converse, it is expected to rise.
(1D chart)
If it falls below 0.04187, there is a possibility of entering the mid- to long-term investment area, so careful trading is required.
(buy)
- After confirming the support at 0.05336
(Stop Loss)
- When the resistance falls below 0.05073
(Sell)
- When resistance is received in the range of 0.06375 - 0.06858
- When resistance is received in the range of 0.07448-0.07962
------------------------------------------------------------ -------------------------------------------
** All indicators are lagging indicators.
Therefore, it is important to be aware that the indicator moves accordingly with the movement of price and volume.
However, for convenience, we are talking in reverse for the interpretation of the indicator.
** The MRHAB-T indicator used in the chart is an indicator of our channel that has not been released yet.
** The OBV indicator was re-created by applying a formula to the DepthHouse Trading indicator, an indicator disclosed by oh92. (Thanks for this.)
** Support or resistance is based on the closing price of the 1D chart.
** All descriptions are for reference only and do not guarantee a profit or loss in investment.
(Short-term Stop Loss can be said to be a point where profit and loss can be preserved or additional entry can be made through split trading. It is a short-term investment perspective.)
---------------------------------

JST Analysis It seems double bottom will be formed. with Neckline = 0.10137 and Pattern target is 0.16815.
For the first phase all Entry points, stopl loss and takeprofits are clear on chart.
the next phase based on the quality of price movement around neckline will be updated.

JST LONG CRYPTO SIGNAL Nice to meet you, everyone
I'm an alt trader
I am a South Korean soldier
I'm analyzing and recommending things that are similar to my personality among many alt coins
the red line is the resistance
each should make a profit

JUST JST Price Targets and Stop LossJST/USDT
Entry Range: $0.070 - 0.074
Price Target 1: $0.077
Price Target 2: $0.082
Price Target 3: $0.092
Stop Loss: $0.067
first entry
sell signal

JUST JST Price Targets and Stop LossJST/USDT shot
Entry Range: $0.075 - 0.080
Price Target 1: $0.069
Price Target 2: $0.065
Price Target 3: $0.060
Stop Loss: $0.087
previews chart all targets reached

JUST JST Price Targets and Stop LossJST/USDT
Entry Range: $0.053 - 0.060
Price Target 1: $0.068
Price Target 2: $0.083
Price Target 3: $0.10
Stop Loss: $0.046


JSTUSDTEntry: below 0.07975
TP1: 0.0855 (7.17%)
TP2: 0.09240 (14.73%)
SL: 0.734 (-7.9%)
RR: 1:2
Ichimoku settings:
30 60 120 30
Note: MACD should go a little lower so wait for entry!

jstpure price action as btc bulls fail in breaking ascending channel. price must go above blue line otherwise blood bath

Breakout in JUST (JST) Coin...Chart is self explanatory. Entry, Targets and Stop Loss are mentioned on the chart.
Disclaimer: This is for demonstration and educational purpose only. This is not buying or selling recommendations. Please consult your financial advisor before taking any trade.

JUSTUSDT: Elliot Wave 1HHi again. In 1 Hour timeframe of justusdt we see end of "a" and now start the c leg of "b" uptrend at this chart and go down to complete the C wave of "4th" wave .

JUSTUSDT: Elliot Wave (UPDATE) DailyHello Friends. I published the analysis of this currency by Elliot wave for "c" leg of the (b) wave and we know that it formed of 5 waves and I expecting it's end at 0.13550 and start to complete correction waves by (c) wave it's end at 0.02380. Please Like and Share my idea. Thanks you.

UPDATE JSTUSDT /the best entry for long is now.Been watching JST for few days and saw the swing low which is a signal for a reaccumulation phase of a graph. If we see a pump anytime now it will go continuously till selling pressure comes

JST posible new pump if the break out is successAfter a pump happened, we saw an attempt to break out to the downward channel by JST if it continues it will pump possible tomorrow

Risky portfolio token JST algo signal - #cryptocurrency #bitcoinThe algorithm triggered a buy stop signal on JST. You can use it to either average down your portfolio position or swing trade. Always SPOT positions.If the swing trade goes against you by 20% then trade it back for a stablecoin. Not financial advice.
#cryptocurrency #bitcoin #blockchain #btc #crypto #ethereum #eth #altcoin

JST pumps 45%, whats next?Small update:
JST pumped 45% after breaking out of the ichimoku cloud, and bullish signal of the Supertrend Ninja - Clean (green vertical line). It crushed several resistances. Currently RSI, Constance Brown RSI and the CCI are all over overbought. Taking positions right now is extremely dangerous and have an unfavorable risk to reward (R:R). I would expect a correction first before possible another leg up. Currently JST is on wave C.
Supports and Resistances are highlighted as grey blocks.
Thank you for reading.
Namasté 🙏
Disclaimer: Ideas are for entertainment purposes only. Not financial advice. Your own due diligence is highly advised before entering trades. Past performance is no guarantee of future returns.

I hope before another MARKET correction JST give us good profitI hope before another MARKET correction JST give us good profit . always trade on your own idia

jstThe chart breaks the downtrend line chart and a pullback hits the trend line and starts growing again. The target is the channel ceiling, which is approximately 266%.