JST (JUST) Token Analysis 29/04/2021This is an Update of our Past Publication which we are currently holding Tokens and Future Position:
www.tradingview.com
Fundamentals:
JUST is a popular new decentralized finance (DeFi) ecosystem built for the TRON blockchain. It is an entire suite of products that are mostly centered around a decentralized stablecoin lending platform known as JustStable.
The platform launched in August 2020 following an initial exchange offering ( IEO ) on the Poloniex LaunchBase platform earlier that same year, but the native governance token of the platform ( JST ) has been circulating since May 2020.
It is a two-token ecosystem built around the USDJ and JUST ( JST ) tokens. USDJ is a multi-collateral stablecoin that has its value pegged to the value of the US dollar (USD), whereas JST has a variety of functions on the platform — paying interest, helping maintain the platform and participating in its governance, helping to set parameters like interest rates (stability fees) and the minimum collateralization ratio.
To obtain USDJ on JUST, traders need to deposit collateral in the form of supported collateral tokens — including TRON ( TRX ), which are exchanged to PTRX tokens and locked as collateral forming a collateralized debt position ( CDP ). Depending on the amount of collateral deposited, users can then mint and withdraw USDJ, which must later be repaid to retrieve the initial collateral.
The platform is designed to provide a fair and borderless hub of DeFi products, that any TRON user can access.
Unlike most other DeFi platforms, JUST isn’t just looking to offer a single product that offers utility to a small subset of DeFi users. Instead, it’s attempting to build an entire suite of products that cover a range of DeFi use cases, forming the foundations of a complete DeFi ecosystem on TRON.
As of January 2021, the JUST ecosystem consists of five distinct products, all of which are designed to interoperate and provide additional utility to users.
These are:
JustStable: JUST’s flagship decentralized multi-collateral stablecoin platform.
JustLend: A TRON-powered money market protocol that allows users to add liquidity to lending pools and take out low-interest cryptocurrency loans.
JustSwap: An automated market maker ( AMM ) platform used for trustless TRC-20 token swaps and the creation of permissionless liquidity pools.
JustLink: The first decentralized oracle system for the TRON network — used to securely supply smart contracts with real-world data.
Cross-chain tokens: Assets from other blockchains, including Bitcoin ( BTC ), Ethereum (ETH) and Litecoin (LTC), that have been tokenized on TRON and can be used within the JUST ecosystem.
As a TRC-20 token, the JUST Network is secured by the underlying TRON blockchain.
Unlike other platforms that use the energy-intensive proof-of-work (POW) consensus mechanism to maintain the integrity of the blockchain and ward off potential attacks, TRON uses the energy-efficient delegated-proof-of-stake (dPOS) system.
This sees TRON ( TRX ) token holders elect super representatives tasked with generating blocks and packaging transactions. Together, the 27 super representatives are responsible for keeping the network secure.
The JUST ecosystem is managed by the JUST Foundation, which includes individuals from Alibaba, Tencent, IBM and "other world-class internet companies," while JUST's financial analysis team hails from "several global investment banks" according to the project website.
Some of the most prominent individuals include Terance F (a blockchain expert and ex-Barclays and IBM employee), Elvis Zhang (a senior developer and experienced blockchain researcher), C Wu (a specialist in wallets and exchanges) and GL Kong (an experienced blockchain engineer and early crypto adopter).
As of January 2021, a total of 2.26 billion JST is in circulation, out of a maximum supply of 9.9 billion. This represents 23% of the maximum supply.
These tokens are earned by depositing, lending, and providing liquidity on the JUST Network or by completing several other actions — such as by participating in special campaigns.
According to the original IEO on Poloniex, the full JST token supply is distributed as follows:
Seed Sale: 11%
Public Sale (LaunchBase Allocation): 4%
Strategic Partnerships: 26%
Team: 19%
Airdrop (Only for TRX Holders): 10%
Ecosystem: 30%
Further information about the allocation of JST tokens, including the specifics of the vesting period for the JUST team and its inflation rate is currently unknown. However, it is known that all team tokens will be fully vested by April 2022.
The full names and profiles of much of the JUST team is not public. However, it appears that the project shares some overlap with the TRON development team, since the platform was announced by TRON CEO and founder Justin Sun, and has received technical and financial support from TRON.
The live JUST price today is $0.123214 USD with a 24-hour trading volume of $162,872,178 USD. JUST is down 0.22% in the last 24 hours. The current CoinMarketCap ranking is #176, with a live market cap of $278,504,761 USD. It has a circulating supply of 2,260,326,706 JST coins and a max. supply of 9,900,000,000 JST coins.
Technical Analysis:
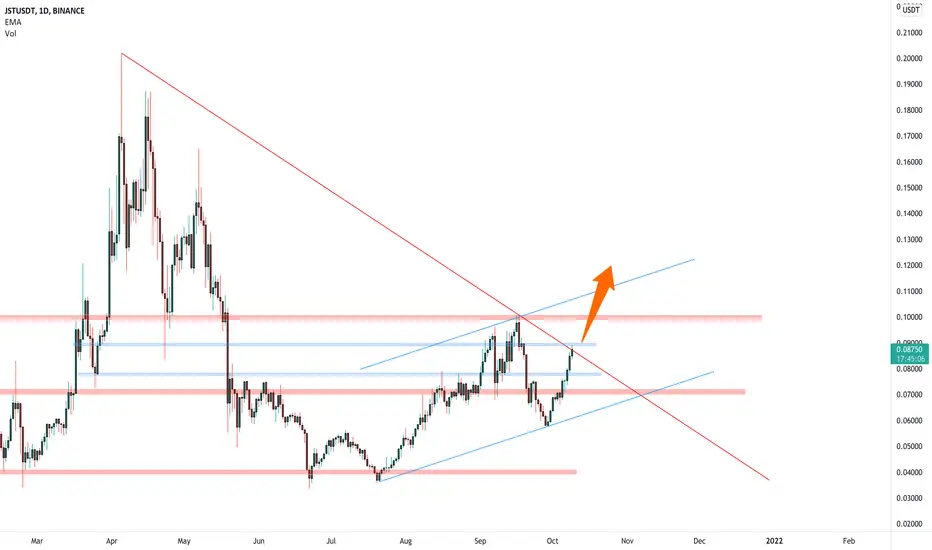
The Token has done its Initialization and accumulation phase and currently is in the retracement of the past Bullish impulsions,
we can see there exist a Hidden Bullish Divergence of Price with MACD Histogram which is the sign of Bullish Trend Cpntinuation
we have updated the Targets with New Low 3 Point of the Fibonacci Projection and Defined 4 New Targets where the 1 TP is the ATH,
4 TP gets its Confirmation as the price Triggers The 3 TP followed bye some Price Correction and Retracement
JSTUST trade ideas


JSTUSDT BullishBased on my technical analysis demand zone monthly timeframe for the JUST crypto,The price has enter inside a demand zone areaWe are expecting a bullish momentum.


jstusdtafter breakout neckline it will be proper point for entry. all the targets are mentioned in the chart.


JSTUSDTBy drawing a downtrend line in the RSE indicator and the presence of a positive divergent HD, as well as drawing a downtrend channel and not breaking it and returning the price, we expect the price to increase up to the channel ceiling. This analysis for Mena Trading

Ascending Triangle on JSTJST (JUST) is moving in an ascending triangle pattern. The pattern will be confirmed in case of breaking out the $0.1 resistance. Target is around $0.165.

JST/USDTThe JST/USDT pair broke the channel and is rising higher. A retest is expected from the first target of 0.10 cent to 0.09 levels, and I guess this will open the way to 0.14cent. Target is 0,70

Long it, JSU, JUST, Justin SunHi
It looks like that "Just" could grow up to $1 dollar in the upcoming "Alt Season".
But all this is a hypothesis.
Growth potential is available.

$JST needs to quit it's rangeAfter this liquidity range, The price will skyrock after quitting its range
this might take a while but it's gonna happen

JST/USDT { JUST } - BULLISH SETUPANALYSIS 🔎
- JST/USDT brokeout above the descending trendline resistance.
- Price action is printing an ascending triangle pattern.
- This is a bullish build up pattern.
- There's a breakout potential.
BUY ENTRY ⬆️
- Market entry: current market price.
- Stop limit entry: breakout above the ascending triangle's horizontal resistance (@0.10100).
- Limit entry: test of the ascending triangle's inclined support.
TARGETS 🎯
- Fibonacci extension levels.
SETUP INVALIDATION ❌
- Breakdown below the ascending triangle's inclined support.

Jstusdt dailyLet's Buy Some #JST ... I have nothing more to say :)))
Follow our other analysis & Feel free to ask any questions you have, we are here to help.

₿ JSTUSDT 1D ₿ : 31.Oct.2021Let's Buy Some #JST ... I have nothing more to say :)))
Follow our other analysis & Feel free to ask any questions you have, we are here to help.
⚠️ This Analysis will be updated ...
👤 Arman Shaban : @Ar_M_An_4
📅 31.Oct.2021
⚠️(DYOR)

jst just !it is really a good project !
hold trx ! hold btt ! hold jst ! hold win!
all of them is trending ! :)))

JST/USDT { JUST } - BULLISH SETUPANALYSIS 🔎
- JST/USDT is printing an ascending triangle pattern.
- An ascending triangle pattern is a bullish build up pattern.
- Price is retesting the horizontal support level and key fibonacci retracement zone (0.618 - 0.702 - 0.786).
- There's a relatively high concentration of buyers at this zone.
- There's a bullish bounce possibility.
BUY ENTRY ⬆️
- Key fibonacci retracement zone (0.618 - 0.702 - 0.786).
TARGETS 🎯
- Ascending triangle's horizontal resistance level (@0.09700).
- Further breakout above the ascending triangle's horizontal resistance could lead to a pump to the fibonacci extension level 1.0 (@0.11223).
SETUP INVALIDATION ❌
- Initial invalidation: breakdown below the 0.786 fibonacci retracement level (@0.07286).
- Final invalidation: breakdown below the ascending triangle's inclined support.


JSTUSDT is testing the weekly dynamic resistanceJSTUSDT is testing the weekly dynamic resistance after a nice breakout from daily one. IF the price is going to have a clear breakout, According to Plancton's strategy (check our Academy), we can set a nice order
–––––
Follow the Shrimp 🦐
Keep in mind.
🟣 Purple structure -> Monthly structure.
🔴 Red structure -> Weekly structure.
🔵 Blue structure -> Daily structure.
🟡 Yellow structure -> 4h structure.
⚫️ Black structure -> <4h structure.
Here is the Plancton0618 technical analysis, please comment below if you have any question.
The ENTRY in the market will be taken only if the condition of the Plancton0618 strategy will trigger.
JSTUSDT Daily TimeframeSNIPER STRATEGY (new version)
It works ALMOST ON ANY CHART.
It produces Weak, Medium and Strong signals based on consisting elements.
NOT ALL TARGETS CAN BE ACHIEVED, let's make that clear.
TARGETS OR ENTRY PRICES ARE STRONG SUPPORT AND RESISTANCE LEVELS SO THEY CAN ACT LIKE PIVOT POINTS AND REVERSE THE WAVE (or act like a mirror that can reflects light) BASED ON STRENGTH OF THAT LEVEL.
ENTRY PRICE BLACK COLOR
MOST PROBABLE SCENARIOS TARGETS GREEN COLOR
LEAST PROBABLE SCENARIOS TARGETS RED COLOR
DO NOT USE THIS STROTEGY FOR LEVERAGED TRADING.
It will not give you the whole wave like any other strategy out there but it will give you a huge part of the wave.
The BEST TIMEFRAMES for this strategy are Daily, Weekly and Monthly however it can work on any timeframe.
Consider those points and you will have a huge advantage in the market.
There is a lot more about this strategy.
It can predict possible target and also give you almost exact buy or sell time on the spot.
I am developing it even more so stay tuned and start to follow me for more signals and forecasts.
START BELIEVING AND GOOD LUCK
HADIMOZAYAN


