JTO/USDT at the Edge of Pressure – Breakout or Breakdown Ahead?🧠 Detailed Technical Analysis (2D Timeframe):
JTO/USDT is currently consolidating at a critical support zone within a well-defined Descending Triangle pattern that has been forming for over 6 months.
Key observations:
Price has been making lower highs, forming a downward-sloping resistance trendl
Related pairs
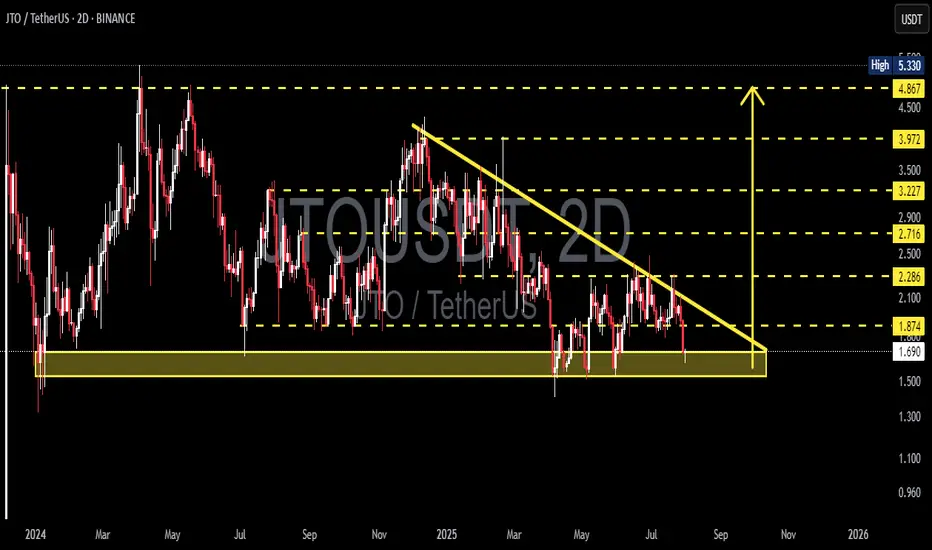
JTOUSDT broke the trendline resistance JTO/USDT was trading at a support level and recently pulled back from it, breaking the trendline support. The price may now rise, with a potential target around 2.8.
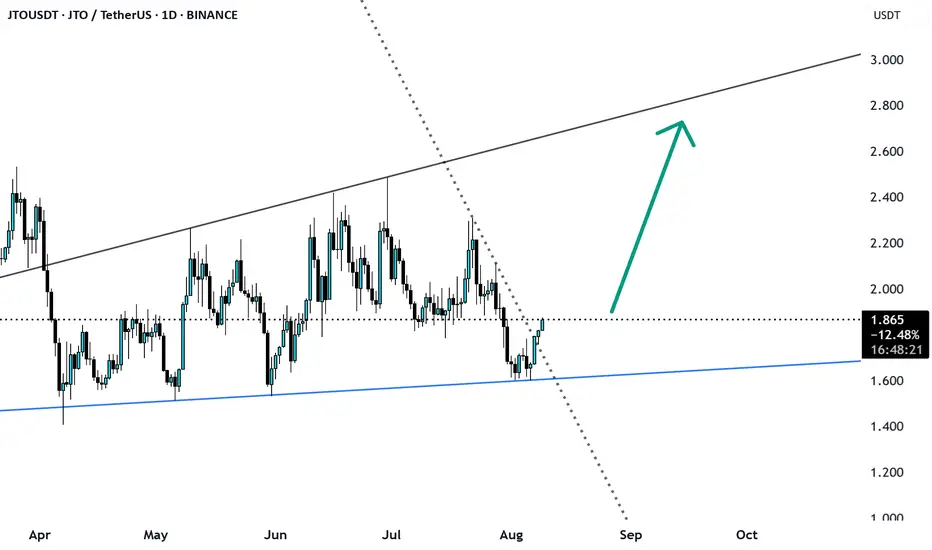
Bullish on JTOUSDTHere we have a very nice setup: JTO finished the big retrace and is now trying breaking the downward trend. On successfull breakout JTO will pump on top of the old upward channel. Volumes are coming, right now we are over all EMAs and very bullish. Best entry would be 1.75$-1.65$ (if JTO comes down
JTO USDT UpdateHELLO 😍
JTO Update
💁♂️ -25% 🔥
I shared this analysis when it was in the entry section. It would be nice to have an update of this analysis.
The JTO cryptocurrency has corrected 25% since the entry zone.
We saw a very good analysis together. What do you think? 😊💖
You can save some profit from th
#JTO/USDT#JTO
The price is moving within a descending channel on the 1-hour frame and is expected to break and continue upward.
We have a trend to stabilize above the 100 moving average once again.
We have a downtrend on the RSI indicator that supports the upward move with a breakout.
We have a support a

#JTO/USDT Forming Bullish Wave #JTO
The price is moving within a descending channel on the 1-hour frame, adhering well to it, and is on its way to breaking it strongly upwards and retesting it.
We have a bounce from the lower boundary of the descending channel. This support is at 1.73.
We have a downtrend on the RSI indicator
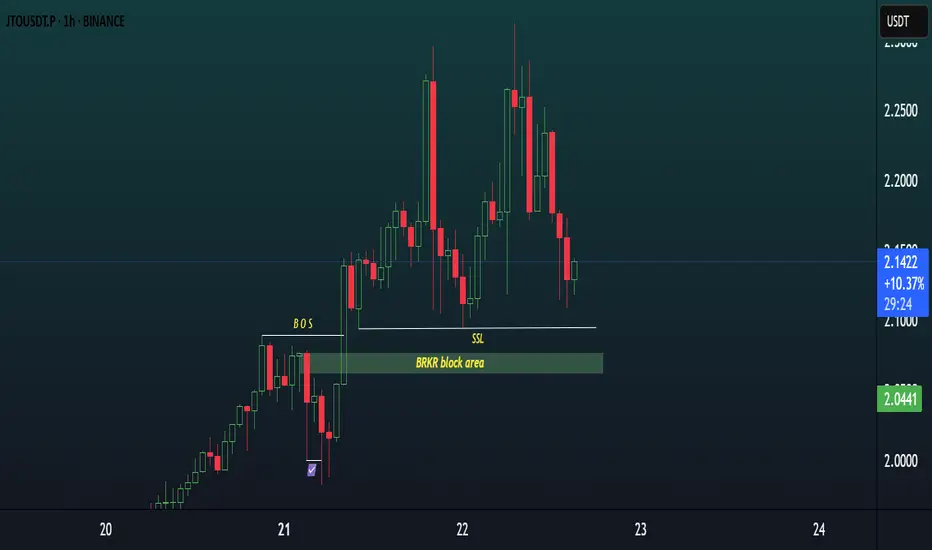
JTOUSDT 1H TIMEFAME ANALYSISMarket Structure: Bullish structure confirmed after a Break of Structure (BOS) to the upside.
Current Price Action: Price is retracing from recent highs and is now approaching a key BRKR block area—a bullish order block zone where the original BOS initiated.
Liquidity Sweep (SSL): Sell-side liquid
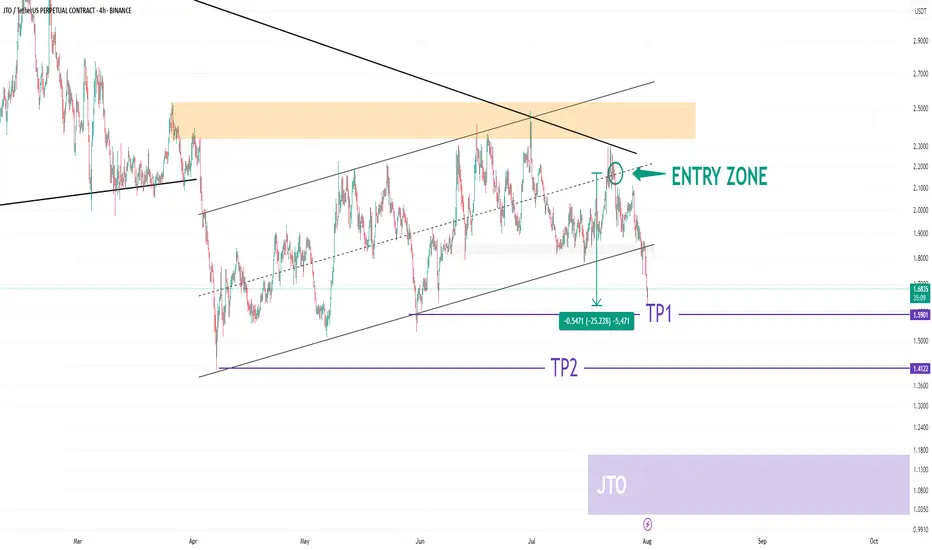
JTO-USDT SHORTI think this cryptocurrency could reach the first and second targets and even the lower purple area and have a price correction.

JTO — 1D Trend Breakout & MSS Hold1. Buy zone: 1.86–1.95 (hold above 1D S/R + MSS)
2. Entry: after trend breakout + MSS confirmation
3. Target: FVGs above, full tp 2.78
4. Stop: below 1.76

#JTO/USDT#JTO
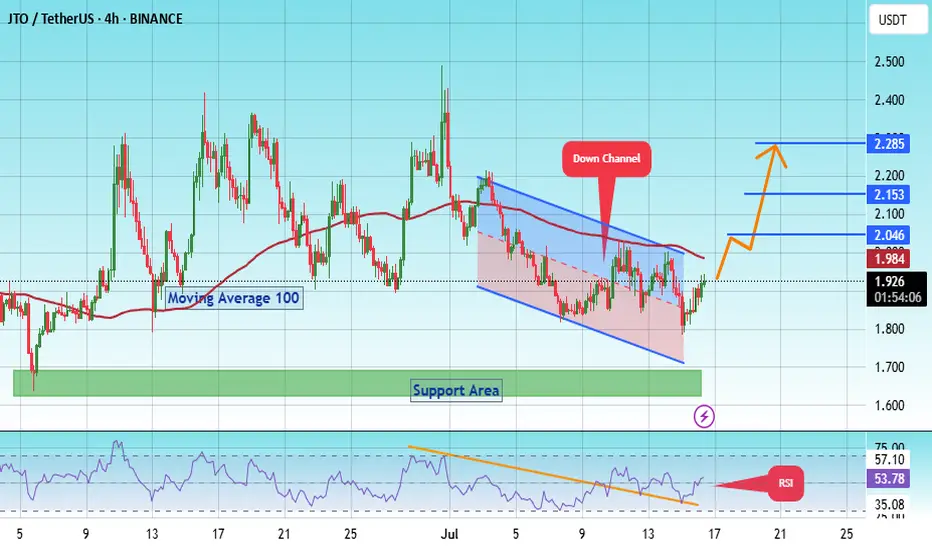
The price is moving within a descending channel on the 1-hour frame, adhering well to it, and is heading toward a strong breakout and retest.
We are experiencing a rebound from the lower boundary of the descending channel, which is support at 2.08.
We are experiencing a downtrend on the RSI i

See all ideas
Summarizing what the indicators are suggesting.
Oscillators
Neutral
SellBuy
Strong sellStrong buy
Strong sellSellNeutralBuyStrong buy
Oscillators
Neutral
SellBuy
Strong sellStrong buy
Strong sellSellNeutralBuyStrong buy
Summary
Neutral
SellBuy
Strong sellStrong buy
Strong sellSellNeutralBuyStrong buy
Summary
Neutral
SellBuy
Strong sellStrong buy
Strong sellSellNeutralBuyStrong buy
Summary
Neutral
SellBuy
Strong sellStrong buy
Strong sellSellNeutralBuyStrong buy
Moving Averages
Neutral
SellBuy
Strong sellStrong buy
Strong sellSellNeutralBuyStrong buy
Moving Averages
Neutral
SellBuy
Strong sellStrong buy
Strong sellSellNeutralBuyStrong buy
Displays a symbol's price movements over previous years to identify recurring trends.
Frequently Asked Questions
The current price of JITO / USDT (JTO) is 1.879 USDT — it has risen 3.68% in the past 24 hours. Try placing this info into the context by checking out what coins are also gaining and losing at the moment and seeing JTO price chart.
JITO / USDT price has risen by 12.80% over the last week, its month performance shows a −1.72% decrease, and as for the last year, JITO / USDT has decreased by −32.60%. See more dynamics on JTO price chart.
Keep track of coins' changes with our Crypto Coins Heatmap.
Keep track of coins' changes with our Crypto Coins Heatmap.
JITO / USDT (JTO) reached its highest price on Apr 3, 2024 — it amounted to 5.330 USDT. Find more insights on the JTO price chart.
See the list of crypto gainers and choose what best fits your strategy.
See the list of crypto gainers and choose what best fits your strategy.
JITO / USDT (JTO) reached the lowest price of 1.323 USDT on Jan 3, 2024. View more JITO / USDT dynamics on the price chart.
See the list of crypto losers to find unexpected opportunities.
See the list of crypto losers to find unexpected opportunities.
The safest choice when buying JTO is to go to a well-known crypto exchange. Some of the popular names are Binance, Coinbase, Kraken. But you'll have to find a reliable broker and create an account first. You can trade JTO right from TradingView charts — just choose a broker and connect to your account.
Crypto markets are famous for their volatility, so one should study all the available stats before adding crypto assets to their portfolio. Very often it's technical analysis that comes in handy. We prepared technical ratings for JITO / USDT (JTO): today its technical analysis shows the neutral signal, and according to the 1 week rating JTO shows the sell signal. And you'd better dig deeper and study 1 month rating too — it's sell. Find inspiration in JITO / USDT trading ideas and keep track of what's moving crypto markets with our crypto news feed.
JITO / USDT (JTO) is just as reliable as any other crypto asset — this corner of the world market is highly volatile. Today, for instance, JITO / USDT is estimated as 3.90% volatile. The only thing it means is that you must prepare and examine all available information before making a decision. And if you're not sure about JITO / USDT, you can find more inspiration in our curated watchlists.
You can discuss JITO / USDT (JTO) with other users in our public chats, Minds or in the comments to Ideas.