Trading Idea for #JTOUSDTI think here we will get accumulation range. With STB and Spring phases.
Liquidity compression at the bottom side needs to be raided before continue an UP-trend.
JTOUSDT trade ideas

JTO buy setupThe price is fluctuating in a range.
First, the liquidity pool at the top of the chart was swept, and now the liquidity pool at the bottom of the candles is expected to sweep and then move upwards.
The targets are clear on the chart.
Closing a candle below the invalidation level will violate the analysis
Note that the financial market is risky, so:
Do not enter any position without confirmation and trigger.
Do not enter a position without setting a stop.
Do not enter a position without capital management.
When we reach the first TP, save some profit and try to move the stop continuously in the direction of your profit.
If you have any comments please post them, comments will help us improve our performance
Thanks

JTOJTO looks like it is forming a double bottom right at support.
Previous time it did that an almost 50% move to the upside followed.
Watching closely

JTO ANALYSIS (4H)It seems that the price is in a large range, which is moving from the upper part to the lower part of this range.
The green range is a support range.
The price can move from this range to the targets.
The targets are clear on the picture.
Closing a daily candle below the invalidation level will violate the analysis
For risk management, please don't forget stop loss and capital management
When we reach the first target, save some profit and then change the stop to entry
Comment if you have any questions
Thank You

#JTO/USDT#JTO
The price is moving in a bearish channel on a 4-hour frame and is holding it strongly and is about to break it upward
We have a bounce from the green support area at 3.60
We have a tendency to stabilize above the Moving Average 100
We have a downtrend on the RSI that is about to break higher
Entry price is 3.75
First goal 4.33
Second goal 4.66
The third goal is 5.00

JTO ,Will we grow before the 59% correction?A very important zone (4.8 - 5.3) $ has formed a resistance level in the past and is now ripe for a breakout.
There are a few scenarios that could play out:
Breakout of this zone (4.8 - 5.3) $ followed by a pullback and move towards the first target zone (8.4 - 9)$.
Or hit the area ($4.8-5.3) and then we can correct
Keep in mind that as long as we are above the uptrend line, this currency will be in an uptrend.
And after breaking out of the main zone (4.8 - 5.3) dollars, we can consider the final target (12.5 - 13.5) dollars based on Fibonacci.
Of course, there is still a lot of time before the final target.
This is an analysis and not financial advice. Please do your own research before trading.

Jto idea updateJto chart was shared few days back. It played very well, idea was right and direction was aslo right and also price came below and took liquidity (SSL).But unfortunately didnt filled our marked entry point. Now I am looking for another liquidity sweep around SSL that i have also marked then towards 6$

JtoJto has clean chart. Below sell side liquidity there is FVG which is my entry point. Price can pump towards higher liquidity after grabbing lower SSL around marked FVG.

JTOUSDT in AB=CD PatternJTOUSDT has formed a harmonics pattern in the presence of divergence which indicates that a reversal is likely.

JTO | Solana Liquid StakingJito is a token with a good-looking chart. It's trading above both the daily SMA-50 and SMA-10. It has broken the diagonal resistance and might be ready to make an upward move. It's also one of the smaller tokens with good volume

$JTO BREAKOUT bullish symmetrical triangle in 1D ** CRYPTOCAP:JTO BREAKOUT bullish symmetrical triangle in 1D **
`To trade a bullish symmetrical triangle, observe a consolidation pattern formed by converging trendlines with higher lows and lower highs. Wait for a breakout above the upper trendline accompanied by increased volume, signaling potential upward momentum. Enter a long position after the breakout, aiming for a price target approximately equal to the height of the triangle pattern. Use stop-loss orders to manage risk in case of a false breakout.`

JTOUSDT(Jito) Daily tf Range Updated till 03-05-24JTOUSDT(Jito) Daily timeframe range. even things are slow right now, it got lots of potential from a price discovery. very close to 3.824 clearing it up will lead it to its old high range level. but for that needs to stay above 2.651.

JTOUSDT Bullish Parallel ChannelJTOUSDT has formed the ascending parallel channel in the absence of divergence which indicates the continuation of bullish pattern

Points on interetsAlmost nothing happens the way we predict. But I have drawn the most important trends in WHITE. prices are most likely respect those lines, It will definitively help you to identity your entries and exits.
Good luck.

JTO ANALYSIS🚀#JTO Analysis : Breakout
🔮.#JTO is ready for a good bullish wave after successful breakout in this move we can see price around 6.500$ soon ✴️
Maximum chance to gain +90% profit💸 in coming days 💯✅
🔰Current Price: $3.586
🎯 Target Price: $4.900
⚡️What to do ?
👀Keep an eye on #JTO price action. We can trade according to the chart and make some profits⚡️⚡️
#JTO #Cryptocurrency #TechnicalAnalysis #DYOR

JTOUSDT Buy IdeaBINANCE:JTOUSDT has broken it's ascending trendline and formed a new Higher High. Currently, It's retracing towards fib 50-75% discounted levels where we can look for buying opportunities

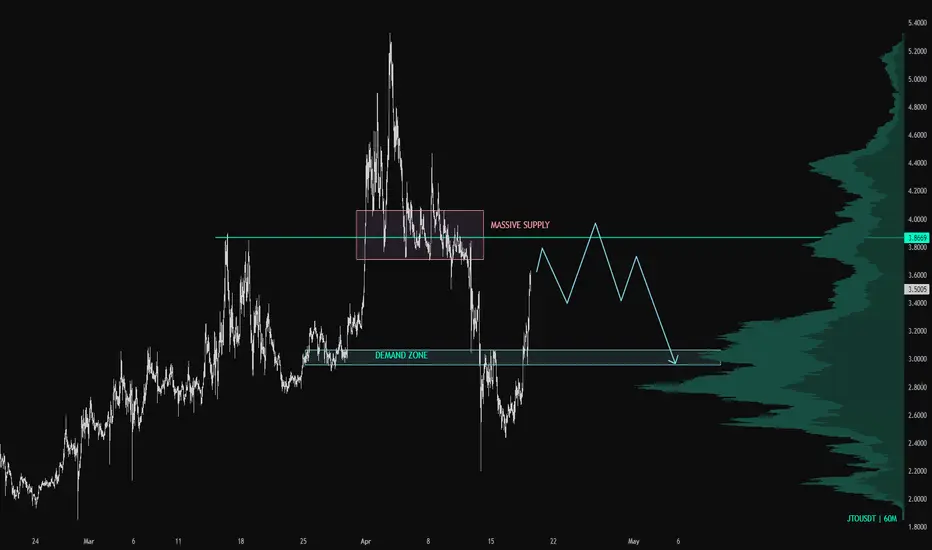
JTO/USDT Keen an eye on the demand for anticipate the reversal!💎 Paradisers, the recent market dynamics surrounding #JTO have indeed been noteworthy.
💎 The successful bounce observed upon revisiting the support trendline area, coupled with the reclamation of the demand zone around $3.1, reflects positive momentum.
💎 Additionally, the price tested the resistance area, coinciding with the golden ratio of 0.618. However, encountering rejection at this level suggests potential retesting of the demand zone at $3.1 - $2.9 to gather momentum for another attempt at breaking the resistance. A successful breakout could pave the way for reaching our target supply zone.
💎 Should JTO fail to bounce upon retesting the demand and instead break below this area, there's a possibility of revisiting the support trendline or even descending further towards the Bullish OB area.
💎 Ideally, JTO would only touch the OB area with a wick, similar to previous instances. A confirmed break below the support trendline would signal bearish momentum, potentially leading to further downward movement.
💎 JTO's price must remain above the Bullish OB area around $2.2. A breach of this level, coupled with a candle close below it, would validate bearish sentiments.
MyCryptoParadise
iFeel the success🌴

📊#JTO corrects after completing the target📈🧠We made a correction after reaching the target area of the double bottom structure, and now we have reached a new buying area, with expectations of a rebound.
⚠️Don’t forget risk management💯
✔️Trade safe✔️
🤜If you like my analysis, please like 💖and share it💬
💕 Follow me so you don't miss out on any signals and analyze 💯

Scalping Short Idea For JTOCurrently JTO is breaking down from latest support, and trying to move down to resistance area in 3.417. If that area cannot hold enough sellers. Then the sellers will reach 3.294 area

JTOUSD 3DJTO ~ 3D 📈
#JTO Form Pattern Rounding Bottom. This pattern is a Bull pattern. We will make purchases in stages after this resistance block is successfully broken through.

JTO Third ENtry Is Start From Here **Technical Analysis Chart Description:**
Welcome to my Technical Analysis charts on TradingView! Before we dive into the analysis, it's essential to understand some important warnings:
1. **Subjectivity Alert:** Technical analysis involves interpreting market data and chart patterns, which can be subjective. Different analysts may interpret the same data differently, leading to varied conclusions.
2. **Historical Performance Doesn't Guarantee Future Results:** Past price movements do not guarantee future price movements. While historical data can provide insights, it's crucial to consider other factors that could influence price action.
3. **Risk of False Signals:** Technical indicators and chart patterns can produce false signals, leading to potential losses if relied upon blindly. Always cross-verify signals with other indicators or fundamental analysis.
4. **Market Volatility:** Crypto markets are highly volatile and can experience rapid price fluctuations. Be prepared for sudden and unexpected price movements, which may invalidate previously identified patterns.
5. **Risk Management:** Proper risk management is essential. Never invest more than you can afford to lose, and consider using stop-loss orders to mitigate potential losses.
6. **Emotional Bias:** Avoid emotional decision-making based on short-term price movements. Stick to your trading plan and strategy, and don't let fear or greed influence your decisions.
**Disclaimer for Crypto Trading:**
Trading cryptocurrencies carries inherent risks, and it's important to understand the following:
Cryptocurrency markets are highly speculative and can be subject to extreme volatility. Prices can fluctuate significantly within short periods, leading to substantial gains or losses.
Investing in cryptocurrencies involves the risk of total loss of capital. Unlike traditional assets, cryptocurrencies are not backed by any tangible assets or central authority, making them inherently risky.
Regulatory uncertainty and market manipulation are additional risks associated with cryptocurrency trading. Regulatory changes or negative news can have a significant impact on prices.
This analysis is for informational purposes only and should not be construed as financial advice. It's crucial to conduct thorough research and consult with a qualified financial advisor before making any investment decisions in the cryptocurrency markets.
By using this analysis, you acknowledge and accept the risks associated with cryptocurrency trading and agree to trade at your own discretion. The author of this analysis shall not be held responsible for any losses incurred as a result of using the information provided.

$JTO Local Resistance to BreakIf CRYPTOCAP:BTC can shoot up to 68k level, I believe we can see CRYPTOCAP:JTO tapping 3.80 to $4 (previous range)
However, it wouldn't be that easy to break this level in one go so I'm expecting a rejection at this level
The safest level to max bid is around $3 to 2.80 (demand zone)