JUPUSDT Breakout... or Classic Bull Trap?Yello Paradisers are you truly prepared for one of the cleanest and most deceptive setups we've seen on JUPUSDT in weeks? A decisive move is building, but so is a very well-placed trap and only those who remain disciplined will navigate it safely.
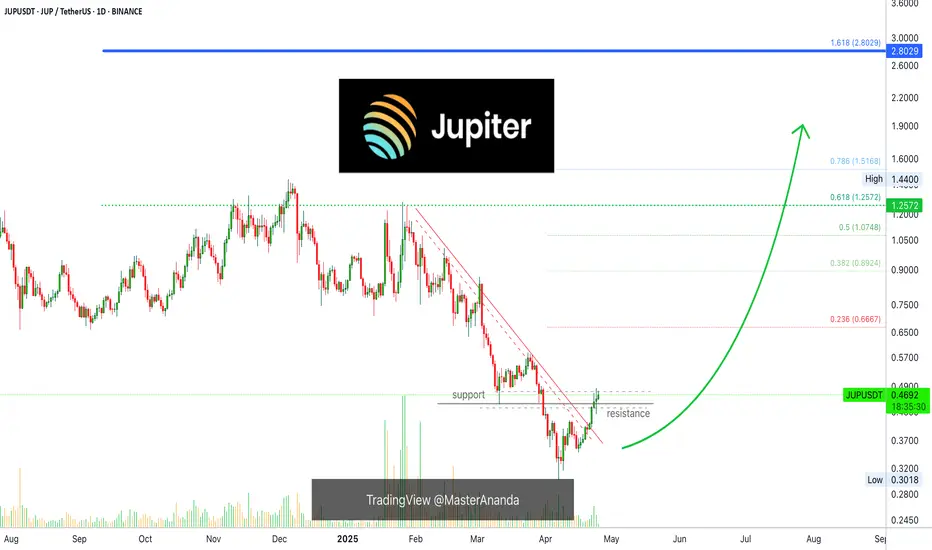
💎#JUPUSDT has broken above a key resistance level that has rejected price action several times in the past. That same level is now being tested as support, and the market’s reaction here will be crucial. If this retest holds, we could see a continuation of the bullish structure with strong upward momentum. But this is precisely where many get caught assuming it’s a straightforward breakout, when in fact it could be the final bait before the flush.
💎The level at $0.5870 is now our line in the sand. If price remains above it, what we are witnessing is likely a healthy pause and consolidation before another impulsive leg upward. However, if $0.5870 fails, the next area of interest is the demand zone near $0.4718. A sharp move into this region could trap late bulls and shake out weak hands. The key will be whether buyers step in aggressively on that dip. A fast and strong rebound from the demand zone would confirm renewed strength, offering a potential high-probability long entry but only if the reaction is immediate and decisive.
💎To the upside, we are watching the moderate resistance around $0.7865, which could slow the move briefly. But the real game begins near the major supply zone at $0.8992. That’s where we expect smart money to begin unloading positions and anyone serious about preserving profits must be prepared to react accordingly.
💎However, if the price fails to hold even the demand zone and breaks below $0.4718, the entire bullish setup gets invalidated. That becomes our structural flip level, and if breached, we’ll turn bearish and prepare for further downside and potential lower lows.
Discipline, patience, robust strategies, and trading tactics are the only ways you can make it long-term in this market.
MyCryptoParadise
iFeel the success🌴
JUPUSDT trade ideas

Jupiter JUP price analysisThe price of OKX:JUPUSDT did not live up to the “multifaceted promises” of marketers and disappointed us...
So we will get rid of #Jup from our portfolio in the designated area.
May all the gods, headed by Zeus, help #Jupiter rises from its knees and cross the $0.80 mark at least for a while
There is nothing more to add, with such dynamics, it will be very difficult to "scrape up" #JUP to at least $1...
_____________________
Did you like our analysis? Leave a comment, like, and follow to get more

JUP Breakout Watch – Cup Formation in Play
LSE:JUP is completing a cup formation and is now testing a key resistance zone. A strong breakout above this level could spark the next leg up.
📍 Breakout Zone: ~$0.60
📈 Targets on Breakout:
🎯 Target 1: $0.7359
🎯 Target 2: $0.8239
🎯 Target 3: $0.9301
Watch for a daily close above the resistance zone to confirm bullish momentum. Volume increase will be key.

JUP/USDT: Classic Inverse Head & Shoulders Breakout!🚀 JUP Inverse Head and Shoulder Breakout – 80% Potential Incoming?! 👀🔥
Hey Traders! If you're all about high-conviction plays and real alpha, smash that 👍 and tap Follow for more setups that actually deliver! 💹💯
JUP is breaking out of a textbook Inverse Head and Shoulders pattern on the 12H timeframe — signaling a strong bullish reversal after a long downtrend.
🟢 Pattern: Inverse H&S
📊 Breakout Confirmation: Neckline flipped into support
🎯 Target Zone: $1.05+
🛡️ Invalidation: Close below $0.534
Momentum is shifting, and bulls seem to be back in charge. If this pattern plays out fully, we’re looking at a potential 70%+ move from current levels.
Let the chart speak. Keep this one on your radar!

JUPUSDT 1D AnalysisJUP ~ 1D Analysis
#JUP Buy gradually after successfully breaking through this resistance line with a short-term target of at least 10%+ from here.

JUP Looks Bullish (4H)From the point where we placed the green arrow on the chart, it appears that the bullish phase of JUP has started in a swing structure.
This phase is a diagonal (Diametric), and it currently seems that wave G is forming. This wave is a bullish wave.
As long as the green box is maintained, the price can move toward the red box.
The closing of a daily candle below the invalidation level will invalidate this analysis.
invalidation level: 0.4322
For risk management, please don't forget stop loss and capital management
Comment if you have any questions
Thank You

JUPUSDT 1D#JUP is moving inside a descending broadening wedge pattern on the daily chart. A breakout above the wedge resistance and the daily MA100 could trigger a move toward the following targets:
🎯 $0.7366
🎯 $0.8709
🎯 $1.0052
🎯 $1.1964
⚠️ Use a tight stop-loss.

$JUP is Struggling but shows signs for HOPEwtf happened to LSE:JUP
It was once heralded at the leading DEX in web3 on the premier blockchain, but dumped ~75% from ATH with only a 57% rally.
Couldn't even make a run at the 200DMA, but retesting the 50 soon.
needs to have a big dally soon above the .236 fib to test the 200DMA. A breakthrough is a strong reversal confirmation.
market cap is about 60% cheaper than BME:UNI so im liking the value here.

JUPITER CONSOLIDATION - When Breakout?LSE:JUP has been seen to range within the box on the 1hr timeframe chart since Friday 9th May and it’s still within the box. What do you expect - upward or downward breakout?
Please support this idea with a LIKE👍 if you find it useful🥳
Happy Trading💰🥳🤗

JUP Technical Analysis – Daily TimeframeJUP Technical Analysis – Daily Timeframe
Currently, JUP is in a corrective phase. To confirm a trend reversal, the price needs to break above the key resistance at $0.60 with strong momentum.
🔸 There is a possibility of a move toward this level and even a false breakout, but for a safer entry, a valid breakout with strong volume is preferred.
If the price fails to break this resistance, a pullback toward lower support levels may occur:
The first support lies around $0.47 on the 4-hour timeframe.
In a more bearish scenario, the price might drop to the daily support at $0.40, which is roughly 25% below the current level.
🔄 However, a bullish reaction from these support zones could potentially reignite the upward trend.
📝 This analysis will be updated as the chart develops. Stay tuned.

JupJupiter analysis
last weeks Jupiter was struggling and it was creating channel with channel character this indicates Jupiter is going toward 1$ but there is low time frame opportunistic for traders
lets check next week our result forecasting
thank you for your boost and comment

Long $JUPLSE:JUP 1D Technical Analysis
LSE:JUP broke out of the descending channel and made a retest on $0.44, the news earlier gave buyers the last opportunity to get in this trade,
Most traders have accumulated a lot of LSE:JUP on Spot trading but I prefer futures.
$1 is imminent, trade with caution as I’m not a financial advisor.

JUP/USDT Analysis — Long SetupOpen Interest is rising along with the price = new positions being added throughout the move → everything looks clean so far.
But what makes it really interesting is that top traders have been fully short since the beginning.
A 2.2 ratio = they kept positioning against the trend the whole time.
Meanwhile, the move is spot-driven → Spot CVD is rising, showing real buying pressure.
On the other hand, Futures CVD is diverging, meaning aggressive shorting while spot keeps pushing higher.
Sellers are fueling the move and getting absorbed = bullish.
On the Kingfisher side, the optical multi level at 0.4811 has already been tapped → the shorts have been flushed, clearly visible.
🎯 Conclusion:
Everything is aligned for a clean long scalp.

JUP Predicts The Future: Crypto Bull Market Certainty Level 100%Jupiter has been rising for 10 days straight. This hasn't happen since October 2024. The bullish bias has been revealed. This is a type of bullish consolidation. The action is back above the 11-March low. Yesterday's session wicked below, closed above. Bullish, bullish, bullish all across.
Jupiter is preparing for a nice jump.
Good evening my fellow Cryptocurrency special-genius trader, it gets better everyday.
What if... Right!
Do you agree? Ok!
The support/resistance dynamic is back in full view.
The continued growth is a very much strong revealing signal should be paid attention to. It works.
Signals like these are simple signals but can reveal everything, it works really good trust me.
Ten days straight moving up. There is a red candle in-between the rise but this does not nullify in any way the rise. It works. Trust me.
It is actually quite entertaining when you see the results.
Making the prediction is nothing, it is great when you see it work.
So these are the signals, simple signals and yet it works.
Watch! Jupiter (JUPUSDT) is set to grow. Deduction/conclusion arrived at based on the chart. 100% the chart even predicts political events. It has been proven many time now in the recent weeks. See this...
Major events will develop that will propel the market up. Political events, why? The charts are bullish and pointing up to massive growth. If any event is needed, the market creates it so soon these events will be public and the market grows.
The market grows because it is set to grow. It has already been decided it is already true. It only needs to show in the prices and charts.
It is like you apply for a job and you get it but you have to wait 3 months before your entry date. It is a done-deal, it is a secured deal it cannot be cancelled but you aren't still working but you know for certain. Something like this but with a higher level of certainty.
Say you have a family member 99 years old with terminal cancer and ready to go. The news are in, the data is in and everybody knows but the person is still alive. It is a done deal, it hasn't happened but will happen. Something like this. Things can be certain and yet not materialized. These things happen.
It can happen that it has been decided, it is known for a fact and sure the market will grow. Yet, it hasn't happened but this doesn't mean that it is questionable, some things can't be changed.
It can't be avoided and nobody wants to avoid it. It is the other way around, most of the majority want it to happen and it will happen. No other scenario is possible that's how the world works.
Tomorrow, it is day. Later, the night. Repeat over and over, nothing can avoid this reality from happening. Times change, it is the same.
One day it is the banks, the next day it is Crypto.
Namaste.
JUP Long Spot Trade Setup – Oversold and Approaching Key SupportJUP is showing strong signs of oversold conditions and is now approaching a major support zone ($0.22 – $0.30). This area offers a favorable risk-to-reward opportunity for a bounce if buyers step in.
📌 Trade Setup:
Entry Zone: $0.22 – $0.30
Take Profit Targets:
🥇 $0.4050
🥈 $0.4467
Stop Loss: Just below $0.20


JUPUSDT is formingJUPUSDT is forming a base for a push higher to 0.4900and 0.5300 in the next cycle.
Buy 0.4310 with a stop at 0.4100

Jupiter Breakdown - Retracement or More Downside?Jupiter ( LSE:JUP ) has broken below the symmetrical triangle, signaling potential further downside. However, a retracement to the $0.70 - $0.90 zone could occur before continuation lower.
Has JUP found its floor, or do we see deeper levels ahead?
Share your thoughts on the possible bottom!
Please support this idea with a LIKE👍 if you find it useful🥳
Happy Trading💰🥳🤗

JUPUSDT 2DJUP ~ 2D Analysis
#JUP Buy gradually from here with a short -term target of at least 15%+. This is a very good support to start buying again.

JUP L0NG TRIGGER JUP facing resistance at consistent levels the past days, a sharp retraction chasing liquidity just below the average stops is imminent followed by a just as quick bounce. Average entry price with multiple limit orders in the range indicated, TP is open for debate and to be managed as the trade plays out.

JUP/USDT
Area entry: blue zone
Sl: 0.42
TP 1: 0.68
About Jupiter
As one of the industry's most advanced swap aggregation engines, Jupiter excels in delivering essential liquidity infrastructure for the Solana ecosystem. Moreover, Jupiter is actively expanding its DeFi product offerings, featuring a comprehensive suite that includes Limit Order, DCA/TWAP, Bridge Comparator, and Perpetuals Trading.

JUPUSDT: Weekly Outlook & Key Levels for JupiterHey everyone! 🌟
Let’s take a look at this weekly cryptocurrency price chart together. Here's what stands out:
We’re looking at two possible scenarios:
Primary Scenario: The price might bounce back from the first support level, marked with a solid yellow arrow.
Secondary Scenario: If it doesn’t, the next potential rebound is from the lower support level, shown with a dashed yellow arrow.
Keep an eye on the numbers highlighted—$0.4310 and $0.3798. These are key price levels that could guide future movements. It’s also essential to monitor liquidity, candlestick patterns, and trading volumes. A strong confirmation, like a favorable candlestick formation and sufficient volume, could signal a rebound.
However, if the price dips below these critical levels, it might shift the perspective. Staying vigilant is key.
Always remember, this is just an observation. Do your own research, stay informed, and keep learning. The journey in the crypto world is as much about growth as it is about numbers! 📚📈✨

JUP in Danger: Are We in for a Crash?JUP has been on a four-day downtrend, and it's starting to show its bearish side. The token has lost its yearly open, which was a major support level. Let’s break down the key support and resistance to see what the chart is telling us.
Support & Resistance
Resistance:
Yearly Open & Monthly Level: JUP has dropped below the yearly open at $0.8169 and the monthly level at $0.7427
Support:
Long-Term Range & Liquidity: JUP has been trading within a range for over 300 days, with a significant amount of liquidity below the low at $0.6328 from 5 July 2024.
POC: The volume profile shows the POC sitting at around $0.5, marking an attractive entry point for a long position.
Fibonacci Confluence: The 0.786 Fibonacci retracement level falls just below the key low at $0.431 (a level last seen on 12 February 2024), offering a great long trade setup.
Long Trade Opportunity:
Alarms are set, let's see if JUP drops to these key support levels. If it does, we could have a solid long setup on our hands.
