JUVUSDT Forming Bullish MomentumJUVUSDT is showing signs of a strong recovery from its recent consolidation phase, with a clear bullish momentum starting to emerge. The price action has bounced confidently from a well-defined support zone, highlighted in the chart, and buyers have stepped in aggressively. This indicates strong market interest and could be the early stage of a new upward trend. The expected upside potential ranges from 30% to 40%+, supported by increasing volume and favorable sentiment.
The token is now trading just above a key breakout zone, which has historically acted as resistance but is now turning into strong support. This shift in market structure is often a signal of a bullish reversal. Given the recent breakout attempt and minor pullback for retesting, the chart suggests JUVUSDT may be gearing up for a significant push toward the next resistance level. Technical indicators such as RSI and MACD also hint at further bullish continuation if current levels hold.
Investor interest in JUV is steadily growing, with fundamentals and market sentiment aligning to support a short-to-mid-term rally. The project’s presence in the fan token sector, along with improving volume trends on major exchanges like Binance, reflects increasing confidence among traders and crypto investors.
Traders keeping a close eye on potential breakout setups should not overlook JUVUSDT. The current technical setup offers a promising opportunity with a favorable risk-reward ratio, especially if the bullish momentum accelerates from here.
✅ Show your support by hitting the like button and
✅ Leaving a comment below! (What is You opinion about this Coin)
Your feedback and engagement keep me inspired to share more insightful market analysis with you!
JUVUSDT trade ideas

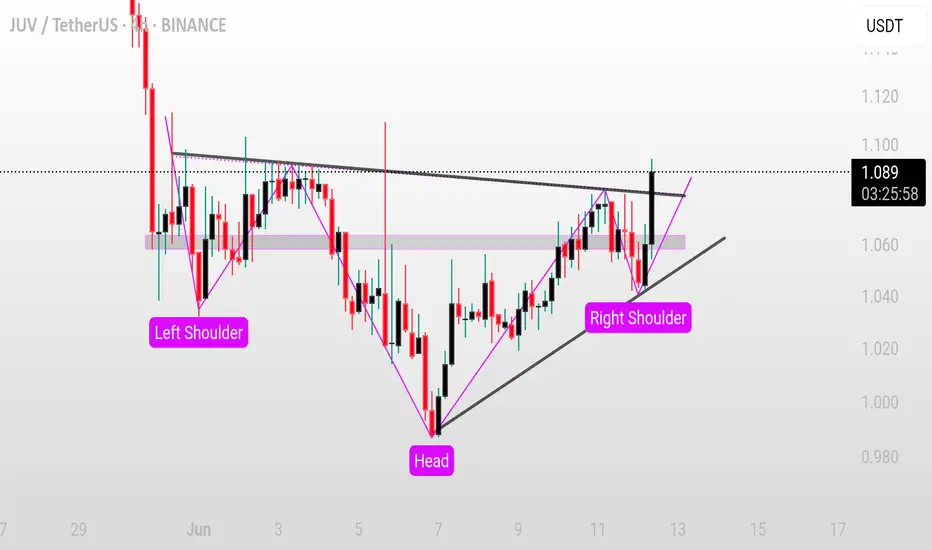
JUV/USDT (4H) – Inverse Head and Shoulders Breakout Setup
JUV/USDT (4H) – Inverse Head and Shoulders Breakout Setup
Pattern: Inverse Head and Shoulders 👕
Timeframe: 4-Hour ⏱️
Pair: JUV/USDT 💱
Published: June 12, 2025 📅
---
Technical Overview:
JUV/USDT is developing a textbook inverse head and shoulders pattern, signaling a possible trend reversal. The left shoulder formed near 1.040, the head reached down to 0.980, and the right shoulder is forming again around 1.040. A descending neckline is being tested near 1.080. A confirmed breakout could open room for upside continuation 📈.
---
Potential Trade Setup:
Bullish Scenario ✅
Entry: On a confirmed 4H candle close above 1.080 with strong volume
Targets:
* First target at 1.140 🎯
* Second target at 1.180 🎯
Stop-loss: Below the right shoulder at 1.030 🛑
Bearish Scenario ❌
Invalidation: Failure to break the neckline followed by rejection at or below 1.080
Confirmation: Breakdown below the rising trendline supporting the right shoulder
Targets:
* First target at 1.000 📉
* Second target at 0.980 📉
Stop-loss (if shorting): Above neckline at 1.085 🛑
---
Risk Management ⚠️
A false breakout or rejection from the neckline without volume confirmation could trap early bulls. If the price breaks below the right shoulder and trendline, bearish momentum may resume. Always wait for confirmation and use protective stops 📊.
---
Conclusion:
JUV is testing a major technical pattern. A confirmed breakout can lead to strong gains, while failure may push the price back toward recent lows. Let the structure complete and act only on confirmed moves 🔍⏳.
Juventus Fan Token Triple-Up, Easy 365% Or 609% Weeks Or DaysWould you like to see a sudden, fast strong jump? I present to you the Juventus Fan Token, JUVUSDT. This one will do just that in the coming days.
Stop. Pause. Wait a minute. The wait can extend for a few days to a few weeks but that's about it. The maximum is a few weeks but mostly several days for a strong bullish jump.
How I do know? It is easy based on the current chart.
There is a clear bottom sequence, reversal sequence as well as bullish momentum building up.
One of the strongest signals pointing to fast growth is bullish consolidation, when prices rise slowly; slow and steady growth. This is happening here. The same happened with Notcoin before 100% growth and that's just the start. Same for OGUSDT and ATMUSDT, you can search my profile to find those. @MasterAnanda
I love this type of chart because it can triple-up your portfolio, or your capital in a matter of days. Of course, to triple-up your entire capital you would have to make a risky bet/trade but that's ok. You are big, you are an adult and you are smart. You choose how to approach this and other coins.
I give you here a great chart, great prices and absolutely awesome timing, it doesn't get any better namaste.
I will keep it simple because simple is best. You can aim for 365% (profits) or 609%.
That's what I love about Crypto. Easy but big profits.
Take action now.
Enjoy the profits and repeat the process.
Win-win-win-win-win. Over and over, again and again.
This bull market is the opportunity to earn big to play the market long-term, or to retire.
The choice is yours.
Namaste.

JUVUSDT: Descending Channel – 120%-130% Gains on Breakout!JUVUSDT is currently forming a Descending Channel pattern, and it is looking for a breakout in the near future. The Descending Channel is a bearish technical pattern where the price oscillates between parallel descending trendlines, indicating that the price is in a downtrend. However, the pattern often leads to a breakout to the upside once the price clears the upper resistance trendline. With strong volume backing the pattern, the breakout could signal the start of a major bullish move, potentially driving the price up by 120% to 130%+.
The good volume behind the Descending Channel formation shows that the market is actively watching this level. A breakout from a descending channel often leads to a sharp rally, as many traders will jump in once the price breaks through the upper resistance. The growing investor interest in JUVUSDT suggests that the market is becoming more optimistic about the potential upside. This increasing participation could fuel the breakout, pushing the price higher and leading to the anticipated 120% to 130%+ gain.
The potential for substantial gains in JUVUSDT becomes more apparent as the price nears the breakout point. The Descending Channel pattern is typically followed by a reversal, especially when the price breaks through the resistance and gains momentum. If JUVUSDT can maintain strength at these levels and break above the upper trendline of the channel, a bullish phase could begin, driving the price to new highs. With the increasing volume and investor interest, the projected 120% to 130%+ gain is within reach.
Traders should monitor the price closely as it approaches the resistance trendline, looking for confirmation of the breakout. A successful breakout above the Descending Channel could result in a swift upward movement, providing significant returns for those who position themselves ahead of the move. The combination of a clear technical setup, strong volume, and growing investor interest makes JUVUSDT a prime candidate for those seeking high-potential trades.
✅ Show your support by hitting the like button and
✅ Leaving a comment below!
Your feedback and engagement keep me inspired to share more insightful market analysis with you!

JUVUSDT CHART ANALYSİS- EDUCATİONAL POSTThe NFT Concept
You may already know that each unit of value in a blockchain is called a token. In an open blockchain, all tokens are equal and interchangeable. For example, one bitcoin can be easily replaced with another, and nothing will change.
Non-fungible tokens are a game-changer, which work differently. An NFT is a digital asset that cannot be replaced with another token without changing the value and basis of the object.
Like cryptocurrency, NFTs are created on a blockchain, which acts as a database to record all transactions. The blockchain guarantees the uniqueness, safety, and anonymity of non-fungible tokens. Thanks to this system, any user can verify the originality and transparency of the history of a particular NFT through the blockchain.
When you buy an NFT token, you are obtaining a certificate for a digital or real object. However, the work itself doesn’t move anywhere. You only use its digitized file or a certificate of ownership. Once created or purchased, the token sits in perpetual storage. This certificate is just lines of code that confirm it is the token owner who has the original copy of the object.
An NFT token can be compared to a painting, which may belong to a gallery, museum, or individual, but the audience can see it in a catalog or exhibition.
NFT tokens are sold in online marketplaces that operate like Amazon. The creators put them on marketplaces and wait for bids from buyers.
An NFT token can be created by you or by anyone for that matter. To do this, you need to take a digital object (picture, music, photo, etc.), register in a particular marketplace on a platform such as Rarible or OpenSea, and upload the object with a description and price. You will have to pay a fee for creating a blockchain entry on many platforms. However, the costs pay off in most cases, as NFTs are #1 in the crypto world today.

JUVUSDT: High Volume Growth Huge OpportunityJUVUSDT ranks as the 3rd highest volume gainer this week, with a 177% increase in volume. While the price has been hovering near its lowest levels, demand points have been kept moderately higher to reflect potential movement.
The price doesn’t appear expensive, but due to its susceptibility to manipulation, risk management is crucial. Monitor price action closely and avoid overexposure, focusing on controlled entries and exits.
I keep my charts clean and simple because I believe clarity leads to better decisions.
My approach is built on years of experience and a solid track record. I don’t claim to know it all, but I’m confident in my ability to spot high-probability setups.
My Previous Analysis
🐶 DOGEUSDT.P: Next Move
🎨 RENDERUSDT.P: Opportunity of the Month
💎 ETHUSDT.P: Where to Retrace
🟢 BNBUSDT.P: Potential Surge
📊 BTC Dominance: Reaction Zone
🌊 WAVESUSDT.P: Demand Zone Potential
🟣 UNIUSDT.P: Long-Term Trade
🔵 XRPUSDT.P: Entry Zones
🔗 LINKUSDT.P: Follow The River
📈 BTCUSDT.P: Two Key Demand Zones
🟩 POLUSDT: Bullish Momentum
🌟 PENDLEUSDT: Where Opportunity Meets Precision
🔥 BTCUSDT.P: Liquidation of Highly Leveraged Longs
🌊 SOLUSDT.P: SOL's Dip - Your Opportunity
🐸 1000PEPEUSDT.P: Prime Bounce Zone Unlocked
🚀 ETHUSDT.P: Set to Explode - Don't Miss This Game Changer
🤖 IQUSDT: Smart Plan
⚡️ PONDUSDT: A Trade Not Taken Is Better Than a Losing One
💼 STMXUSDT: 2 Buying Areas
🐢 TURBOUSDT: Buy Zones and Buyer Presence

Juventus Fan Token: Predicting A 2,350% Bullish WaveThe black line on the chart is the most important line. We will do a full analysis based on this single line.
JUVUSDT (Juventus Fan Token) hit a bear-market bottom low in May 2022. This is the price that I used to draw the black line. This price level worked as support for years. In July 2024, this level failed as support and we have a long-term rounded bottom. As soon as the action moves back above this level, last week (2-Dec. 2024), we are in bullish territory.
Now, we can couple this up with trading volume, moving averages, the oscillators (RSI and MACD) and marketwide action. All these signals would point toward the start of a major bullish wave.
The pair becomes bearish went it moves below long-term support; black line.
The pair becomes extremely bullish when it moves back above long-term support; black line.
The RSI would have a strong reading and a bullish divergence.
The MACD would be trending up strong and also showing a long-term bullish divergence. The divergence tend to happen in anticipation of a change of trend.
The volume keeps rising favoring the bulls but the market is trading near its all-time low. This signals that buying is happening at bottom prices. People are buying and accumulating, after this pattern we get growth.
Predicting a 2,348% bullish wave.
We take the current price and our projected new All-Time High and this gives us more than 24X potential, around 2,350%. We also have a nice 900% target at $19 and several more targets based on the short-term.
This is a great chart because it is still trading low. When prices are low, we have low risk with a high potential for reward. This is a great hold.
I am wishing for you the best.
Thanks a lot for your continued support, it is appreciated.
Namaste.

JUV/USDT Trading IdeaJUV/USDT Trading Idea
JUV/USDT is consolidating near a key resistance level, hinting at a potential breakout. The price has been forming a structure that suggests increasing momentum, which could lead to a strong move in the coming days.
Key points:
- JUV/USDT is trading close to a resistance zone that has been tested multiple times. A breakout could signal a bullish trend.
- Monitor the trading volume closely; an increase during the breakout will confirm strong market interest.
- Use momentum indicators like RSI to check for overbought or oversold conditions.
Trading tips:
- Wait for a confirmed 4H or daily candle close above the resistance level before entering a trade.
- A retest of the breakout level as support provides a safer entry with reduced risk.
- Always manage your trades with appropriate stop-loss and position sizing to minimize risk.
This is an educational analysis, not financial advice. Always conduct your own research before making trading decisions.

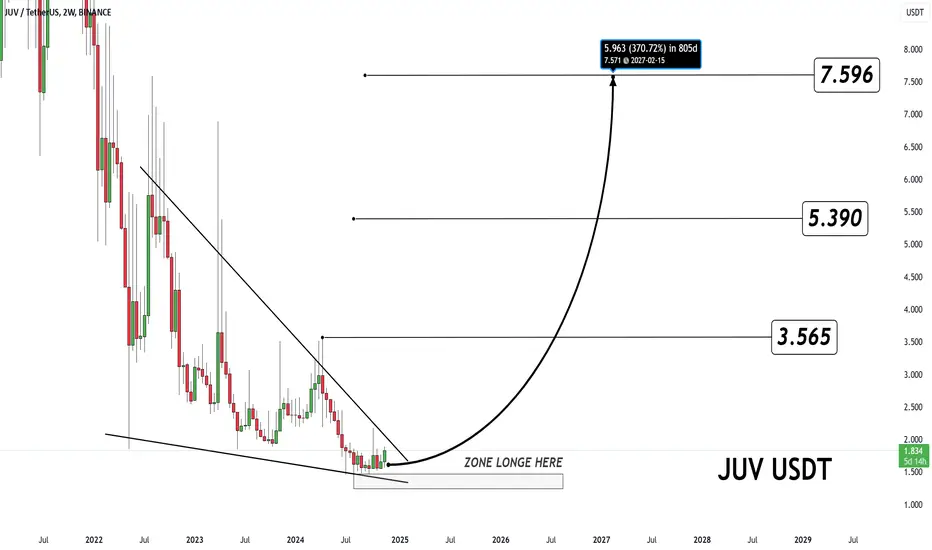
JUV indicates #JUV USDT
GETTEX:JUV indicates a strong long opportunity within the highlighted zone. Entry in this accumulation area aims for gradual price recovery. Targets are set at 3.565, 5.390, and 7.596 for potential long-term gains. Patience is required, as the breakout may align with a multi-year trend reversal. Ensure risk management is applied if price re-enters the support zone.
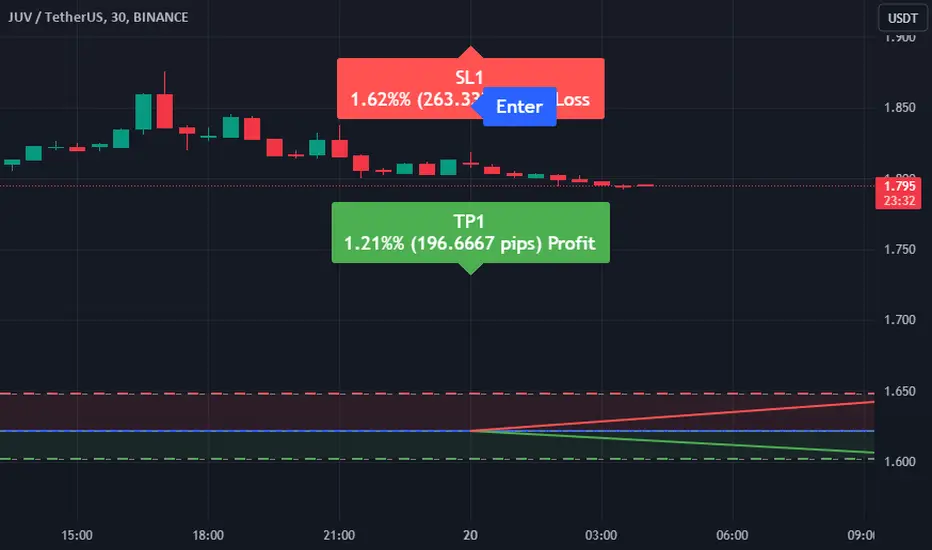
Market Signal for JUVUSDT Pair: SellAttention Traders,
We have identified a potential trading opportunity on the JUVUSDT pair. Using the EASY Quantum Ai strategy, we recommend the following:
Direction: Sell
Enter Price: 1.622
Take Profit: 1.60233333
Stop Loss: 1.64833333
Rationale:
The decision to enter a Sell position at this time is based on several confluences identified by the EASY Quantum Ai strategy:
1. Trend Analysis: JUVUSDT is showing signs of downward momentum, with recent candlestick patterns supporting a bearish trend.
2. Technical Indicators: Key indicators such as the RSI and MACD suggest that the asset is currently overbought, which aligns with a potential price correction.
3. Market Sentiment: Recent market activities and volume indicate increasing selling pressure, which could drive the price down to our target levels.
4. Risk Management: Our stop loss is carefully set to protect against unexpected volatility, while the take profit level seeks to capitalize on the anticipated market movement.
Keep a close watch on price changes and ensure adherence to your risk management strategies. Happy Trading!
#JUV/USDT#JUV
The price is moving in a descending channel on a 1-day frame upwards and is expected to continue
We have a trend to stabilize above the moving average 100 again
We have an upward trend on the RSI indicator that supports the rise by breaking it upwards
We have a support area at the lower limit of the channel at a price of 1.45
Entry price 1.70
First target 1.94
Second target 2.14
Third target 2.43

Juventus Fan Token (Targets)Juventus Fan Token (JUV) can swing more to the upside.
This chart is very similar to the other sports tokens ACM PSG and so on.

JUVUSDTWe can attempt to buy JUVUSDT from specified level as it makes HL , also 0.618 FIB occur indicate that it moves upward.
SL , TP mention in chart.

Seize the Crypto Momentum: Double Bottom Training for a Bright FAn exceptional opportunity looms on the horizon for the JUV cryptocurrency! The chart reveals a perfectly orchestrated Double Bottom formation, marking a potential bull turn. With the two troughs aligned, we hit a sturdy stand, indicating constant buying pressure.
The recent rupture of the neck line, accompanied by an increase in volume, confirms the trend. This is the critical moment when previous resistances become supports, paving the way for soaring prices. By applying W amplitude measurements from the neck line, we project bold bullish targets.

#Juv#Juv
#Juv has formed a falling wedge pattern and is testing a multi-year trendline. This suggests that a bullish breakout is possible, with a potential price move towards

fan token The tokens of fans of reputable football teams have interesting charts after being noticed for a long time, of course,
capital management should be followed before buying any currency.
Note: The negative or positive point of Bitcoin does not have a big impact on the trend of these currencies

JUVUSDT is exhibiting signs of an upward trendThe cryptocurrency JUVUSDT is exhibiting signs of an upward trend, supported by several indicators. Firstly, there has been a consistent increase in trading volume, suggesting heightened market activity and interest in JUVUSDT. Additionally, positive momentum indicators, such as the moving averages, indicate strong bullish sentiment among investors. Moreover, the Relative Strength Index (RSI) is showing JUVUSDT in the overbought territory, signaling potential further upward movement. Furthermore, recent price action has seen JUVUSDT forming higher highs and higher lows, indicating a bullish market structure. Overall, these indicators collectively suggest a bullish outlook for JUVUSDT in the near term, with the potential for continued price appreciation. Traders and investors may consider capitalizing on this upward momentum while exercising caution and monitoring market developments closely.

JUV ANALYSIS🟢#JUV Analysis : Breakout Scenario 💰💰
🚀🚀As we can see that #JUV is trading nearby all time low levels since many days. We can see a breakout in #JUV. The appearance of a falling wedge breakout indicates an upward potential. 📈📈
🔖 Current Price: $2.376
⏳️ Target Price: $5.869
#JUVAnalysis #Cryptocurrency #BreakoutScenario #DYOR

#JUV/USDT - Long - Potential 23.55%Strategy: Long
Exchange: BYBIT
Account: Spot
Entry mode: Market order in range
Invest: 2.5%
Exit:
• Target 2 : 3.053 22.9%
• Target 1 : 2.773 11.63%
Entry: 2.4841 ⌁ 2.4841
• Current market price: 2.4841
Stop: 2.238 (-9.91%)
Technical indicators:
Breakout from trendline, RSI trendline break, buy order support (although there are overhead sell orders so empty a trailing SL), Moving Averages giving us and uptrend and I think the lower edge of the pictured pitchfork is our trend range low.
• ⎿ 24h Volume: 4453.782358
• ⎿ Satoshis: 2.4841
• ⎿ Analysis: TradingView

Juventus targets.These are my middle term targets.
I think the volume increase at the bottom is very positive.
* What i share here is not an investment advice. Please do your own research before investing in any digital asset.
* Never take my personal opinions as investment advice, you may lose all your money.

Juventus fan token weekly chart.Juventus fan token game plan.
* What i share here is not an investment advice. Please do your own research before investing in any digital asset.
* Never take my personal opinions as investment advice, you may lose all your money.

finally juv getting ready for massive breakout seems like juv has bottomed out and getting ready for massive bullish rally
formed falling wedge in 3 days and currently testing multi year trend line and expecting breakout soon
incase of successful breakout expecting 220 to 240% bullish rally

