Resistance is claerly there, just takeitIt just so obvious the delta is there, resistance, just take the trade
Related pairs

$KAS – Three Possible Scenarios in the Near FutureCSE:KAS – Three Possible Scenarios in the Near Future:
🔹 Optimistic: Growth up to $0.21
🔹 Conservative: Growth up to $0.13
🔹 Pessimistic: Decline to $0.035
🚨 Key Levels to Watch:
▪️ $0.075 — a breakout above this level in July could open the path to $0.10 – $0.11
▪️ $0.11 — a breakout above th

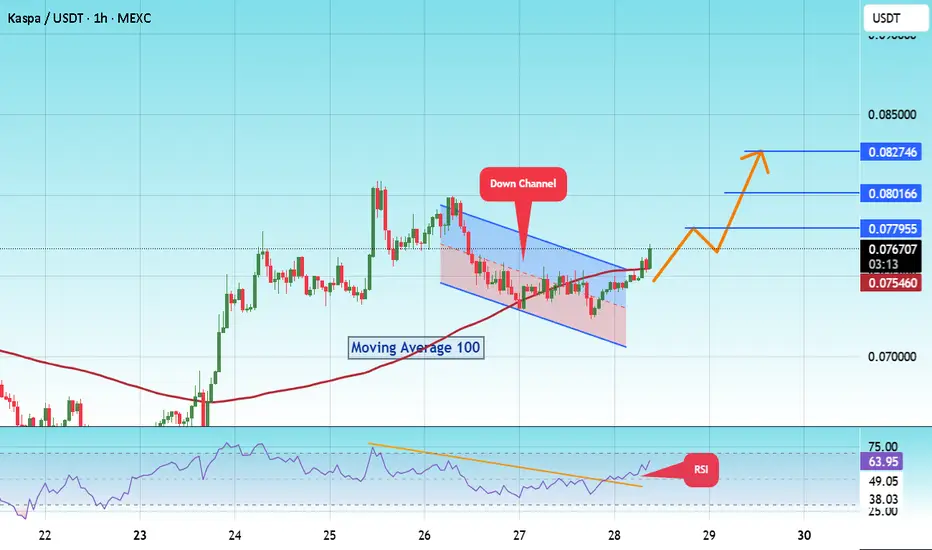
$KASUSDT Breaks Trendline #KAS
The price is moving within a descending channel on the 1-hour frame and is expected to break and continue upward.
We have a trend to stabilize above the 100 moving average once again.
We have a downtrend on the RSI indicator that supports the upward break.
We have a support area at the lowe
KASUSDT Analysis (30-Minute Timeframe) Key Levels on the Chart:
Broken Resistance Turned Support:
Around the 0.07520 – 0.07600 zone, there was a significant resistance area that has now been broken and is acting as new support (shown as a red box on the chart). Price broke above it with a strong candle and is currently consolidating ab

KAS IS TESTING RED RESISTANCE ZONE🚨 KAS Testing Red Resistance – Waiting for Breakout 📈
KAS is currently testing the red resistance zone.
If breakout is confirmed, the first target could be the green line level! 📊

Technical Analysis (KASPA/USDT - Daily Chart)Technical Analysis (KASPA/USDT - Daily Chart)
Trend & Structure Overview
KASPA has been in a prolonged downtrend after peaking near $0.22.
The Elliott Wave structure indicates a completed (A)-(B)-(C) correction pattern after a prior bullish wave (4).
Price is currently testing a triple bottom s

Kaspa (KAS): Seeing Possibility of Break of StructureKaspa coin struggles to have a proper buyside volume, where sellers are showing strong dominance currently, which could lead us to BOS and nasty movement to lower zones (and by nasty I mean big red candle).
Swallow Academy

KAS 0.53 ZONE IS BEST SUPPORTBINANCE:KASUSDT.P is right now facing heavy selling pressure, should plan at 0.052-0.054 zone, not a financial advise, DYOR

KAS-USDT (Bybit spot), 4-hour candles TA+Trade plan1. Market context & chart structure
Asset / venue / timeframe: KAS-USDT (Bybit spot), 4-hour candles, data to 12 Jun 2025 06:45 UTC (see image).
Primary pattern in play: Price has compressed into a contracting (symmetrical) triangle that began after the 28 May low. The apex is only ~1–2 candles a

TradeCityPro | KAS Ranges Near Top with Bullish Momentum Rising👋 Welcome to TradeCity Pro!
In this analysis, I want to review the coin KAS for you. It’s one of the Layer One projects, and its token currently ranks 40 on CoinMarketCap with a market cap of 2.35 billion dollars.
⏳ 4-Hour Timeframe
On the four hour timeframe, the price is moving inside a range box

See all ideas
Summarizing what the indicators are suggesting.
Oscillators
Neutral
SellBuy
Strong sellStrong buy
Strong sellSellNeutralBuyStrong buy
Oscillators
Neutral
SellBuy
Strong sellStrong buy
Strong sellSellNeutralBuyStrong buy
Summary
Neutral
SellBuy
Strong sellStrong buy
Strong sellSellNeutralBuyStrong buy
Summary
Neutral
SellBuy
Strong sellStrong buy
Strong sellSellNeutralBuyStrong buy
Summary
Neutral
SellBuy
Strong sellStrong buy
Strong sellSellNeutralBuyStrong buy
Moving Averages
Neutral
SellBuy
Strong sellStrong buy
Strong sellSellNeutralBuyStrong buy
Moving Averages
Neutral
SellBuy
Strong sellStrong buy
Strong sellSellNeutralBuyStrong buy
Displays a symbol's price movements over previous years to identify recurring trends.
Frequently Asked Questions
The current price of Kaspa/Tether (KAS) is 0.07513 USDT — it has fallen −0.60% in the past 24 hours. Try placing this info into the context by checking out what coins are also gaining and losing at the moment and seeing KAS price chart.
Kaspa/Tether price has fallen by −0.72% over the last week, its month performance shows a −15.15% decrease, and as for the last year, Kaspa/Tether has decreased by −52.73%. See more dynamics on KAS price chart.
Keep track of coins' changes with our Crypto Coins Heatmap.
Keep track of coins' changes with our Crypto Coins Heatmap.
Kaspa/Tether (KAS) reached its highest price on Aug 1, 2024 — it amounted to 0.20780 USDT. Find more insights on the KAS price chart.
See the list of crypto gainers and choose what best fits your strategy.
See the list of crypto gainers and choose what best fits your strategy.
Kaspa/Tether (KAS) reached the lowest price of 0.00152 USDT on Mar 21, 2023. View more Kaspa/Tether dynamics on the price chart.
See the list of crypto losers to find unexpected opportunities.
See the list of crypto losers to find unexpected opportunities.
The safest choice when buying KAS is to go to a well-known crypto exchange. Some of the popular names are Binance, Coinbase, Kraken. But you'll have to find a reliable broker and create an account first. You can trade KAS right from TradingView charts — just choose a broker and connect to your account.
Crypto markets are famous for their volatility, so one should study all the available stats before adding crypto assets to their portfolio. Very often it's technical analysis that comes in handy. We prepared technical ratings for Kaspa/Tether (KAS): today its technical analysis shows the sell signal, and according to the 1 week rating KAS shows the sell signal. And you'd better dig deeper and study 1 month rating too — it's sell. Find inspiration in Kaspa/Tether trading ideas and keep track of what's moving crypto markets with our crypto news feed.
Kaspa/Tether (KAS) is just as reliable as any other crypto asset — this corner of the world market is highly volatile. Today, for instance, Kaspa/Tether is estimated as 1.78% volatile. The only thing it means is that you must prepare and examine all available information before making a decision. And if you're not sure about Kaspa/Tether, you can find more inspiration in our curated watchlists.
You can discuss Kaspa/Tether (KAS) with other users in our public chats, Minds or in the comments to Ideas.