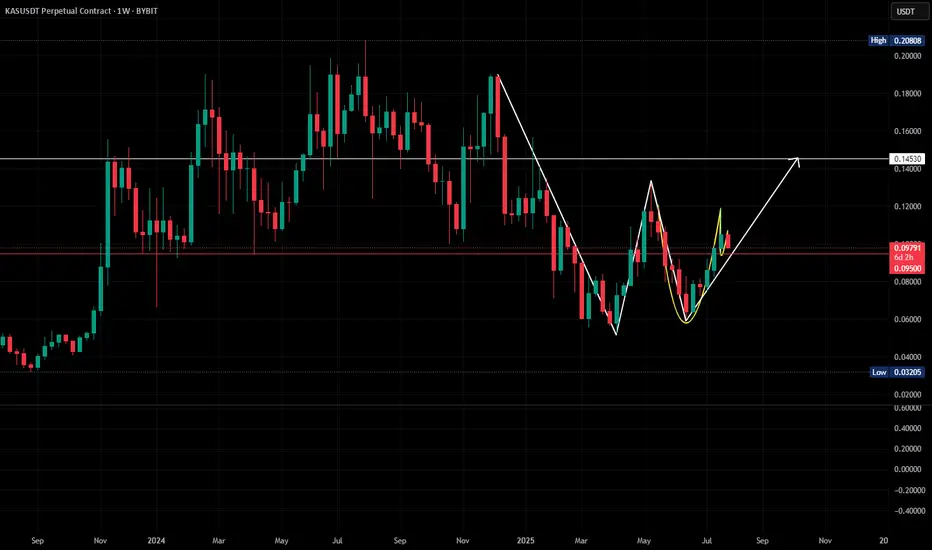
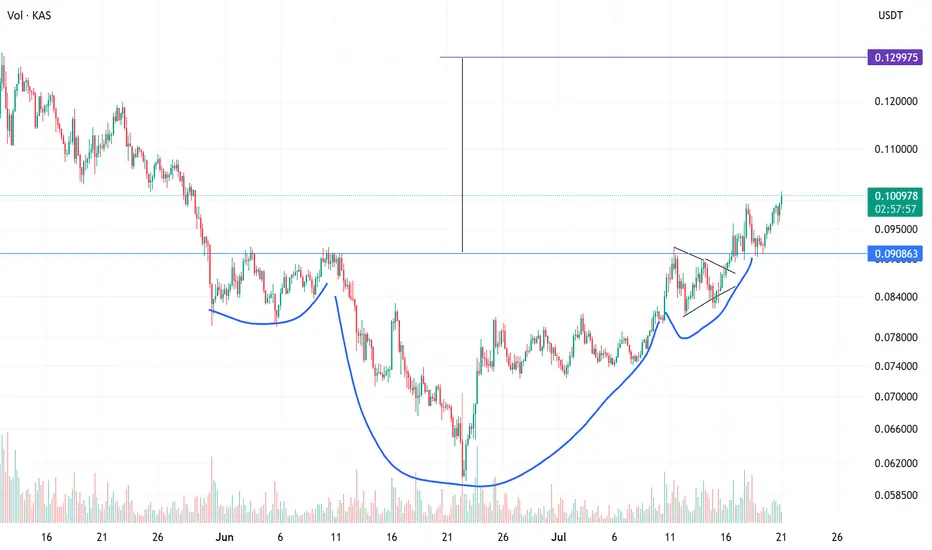
POTENTIAL LONG FOR KASPA (KAS)Timeframe: 1-Day and Weekly Charts
Current Price: $0.097946 (as at July 29, 2025)
Pattern Analysis:
Weekly Chart: Potential double bottom pattern with lows at $0.0527 and $0.0545, and neckline resistance at $0.098995. Current price of 0.0979 is testing this neckline. A breakout above $0.0990 with strong volume confirms the pattern, targeting $0.1453.
1-Day Chart: Cup and handle formation in progress. Handle resistance at ~$0.107196, support at ~$0.098851. A breakout above $0.107 could signal bullish continuation.
Trade Idea:
Entry: Enter long position on a confirmed breakout above $0.0990 (weekly neckline) with strong volume.
Target: $0.1453 (calculated from double bottom height added to neckline).
Stop Loss: Place below $0.0950 to limit downside risk.
Risk-Reward Ratio: ~1.95:1.
Action: Monitor for a close above $0.0990 with high volume to confirm entry.
If price falls below $0.0950, reassess for potential invalidation of the bullish setup.
KASUSDT trade ideas
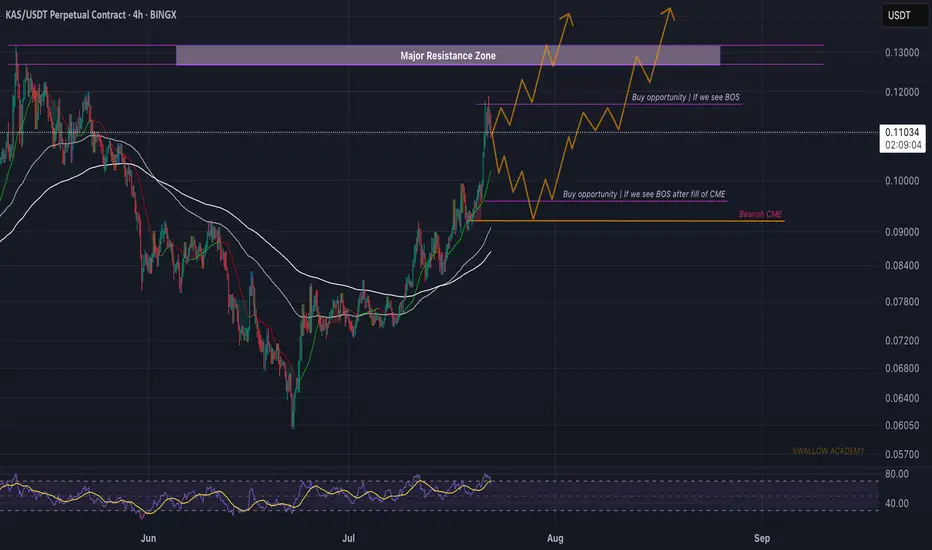
Kaspa (KAS): Looking For Break of Structure, Here or Near CMEKaspa looks pretty bearish right now, possibly going for that MSB currently, but despite that, as we are overall in a bullish trend, we are going to look for buyside movement and trading opportunities here.
So we detected 2 zones for us, one slightly above the current market price and another near the bearish CME, where on both sides we are going to look for a break of structures, which then would give us a good buying opportunity with a really good R:R ratio.
Swallow Academy
Kasusdt long to $0.13Just hopped into Kas long. Its been ripping today. Caught it late but still have good stop and the move hasn't reach target yet.
time sensitive
Sl: $0.108... can chance a tigher stoploss at your own risk. Its been pushing quite impulsively so might not correct big if happens.
Tps on chart
Kas short to $0.10226Just now opened up a short position on Kas. I think structurally the market is high and likely to correct down a bit more before continuation to the upside
Sl: $0.106690
TP: $1.102841-$0.102263

Very simple strat using 15min and 90 min PARVery simple strat using 15min and 90 min PAR. Mainly for scalping trades takling 1-6 hrs

KASPA | Back in Trading RangeKASPA is back in the trading range, presenting a potential bullish setup after flipping the long-term resistance around $0.094 into support. This flip represents a significant technical milestone that often precedes major upward moves.
Key Observations:
Successfully converted major resistance at $0.094 into support
Price is consolidating within the established trading range
RSI showing neutral momentum, leaving room for upside movement
Ascending trendline provides additional support confluence
Trading Setup:
Entry: Now, or wait for trendline break with volume confirmation
Target: Upper resistance zone around $0.18935 (marked in blue)
Stop Loss: Below the prior resistance now turned support at $0.094
Risk Factors:
Overall crypto market sentiment remains a key factor
The projected pink arrow suggests significant upside potential if the breakout materializes, making this an interesting risk-reward setup for patient traders. The successful support flip increases the probability of reaching the upper target zone.
iH&S Triggered and moving to send KAS to 0.13Technical pattern iH&S has triggered with a target 0.13.
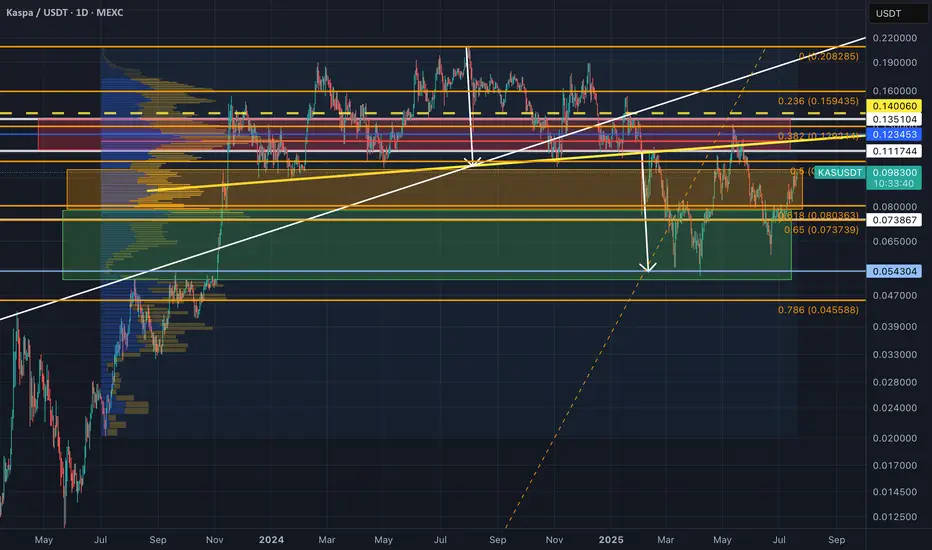
Last chance to reaccumulate Kaspa while it is below 10 cents?Second chance to accumulate CSE:KAS at below 10 cents after its correction down to 5 cents from its 20 cents ATH is coming to an end?
Previously, technicals looked great for CSE:KAS (and other ALTs too) with a breakout from a cup-&-handle pattern in July/Aug2024, but market says otherwise with gloomy economic report. >> For the small portion of capital assigned to trading crypto: I got stopped out from my (manually adjusted) trailing stoploss, with an approx. 6.8%avg loss from my BTC and ETH DCA spot injections into CSE:KAS from 10 cents all the way to 20 cents ATH.
For my long-term investment hold, I had bought from 2 cents all the way to almost ATH (at ~15 cents) and still holding and adding to it now as long as KAS is below. 10 cents. Had started accumulating aggressively again within the green zone, and probably gonna stop soon once KAS leaves the orange zone.
Last cycle, my main Altcoin investment focus was in ADA (POS and UTXO based chain based on academic research and peer-reviewed design), eventually selling most of other ALTs into ADA. This cycle, my personal investment focus is in Kaspa — and probably holding 15%(?) through the bear market correction after blow-off-top into the next cycle together with BTC and some ETH as well. Fingers crossed with regards to price; although the technology, decentralization ethos, and general fundamentals behind it is IMO extremely sound, and has a high probability (though not certain) to eventually establish itself to become one of the (if not THE) top L1s into the future.
———————————————
My reply re. the past YTD price performance of CSE:KAS , which I feel might be worth sharing here.
"For Kaspa, on the YTD timeframe, it has corrected ~50% down, after a ~10x rise from about 2 cents (when I first got in, in 2023) all the way to 20 cents. It is still an early tech about 3 years old and still not widely know; hence as an investment, it is definitely risky and high volatility is to be expected (not listed in high liquidity Tier1 exchanges yet), just like BTC in 2017 where I first bought at ~3kUSD, and a lot more significantly at 5k, and all the way to its ATH at 20kUSD, and stupidly held when it dropped all the way to 3kUSD, and kept on buying with a long-term view.
I view Kaspa in the same light as BTC (different from other cryptos), the only two that I will probably still hold a small but significant portion of, after the blow off top of this cycle due to its fundamentals that I am personally drawn towards -- e.g. POW but 6000x faster than BTC in bps, and ultimately will be 60000x faster once the DAGKnight protocol is implemented in 2026 (trilemma solved); protocol are based on peer-reviewed published research; fair-launched with no-VCs pre-allocation nor pre-mine; no central controlling figure; no DAG/Chain bloating due to implementation of pruning and where 0% TX-archival nodes are needed to maintain the security of mining, and are only necessary for explorers and institutions that intends to track TXs; (soon to come in Q4) Two Layer 2 implementations that will eventually be "Based-Zkrollups" (something that Ethereum planned to implement but was not feasible due to speed and cost issues, even after its POS-fork) -- where L2 TXs are instantly settled onto L1 without security compromising batching of TXs and delayed settlement that Eth-L2s currently does, and more.
But KAS is just a crypto project that I am personally interest in; and I am certainly not recommending anyone to buy as an investment, well unless they see something interesting in it too as I do. ;)"
Kaspa (KAS): Seeing Possibility of Break of StructureKaspa coin struggles to have a proper buyside volume, where sellers are showing strong dominance currently, which could lead us to BOS and nasty movement to lower zones (and by nasty I mean big red candle).
Swallow Academy

Kaspa Bullish · The Wait is Over · Ready to GrowWe have a very interesting situation here with the Kaspa chart, KASUSDT. There is no going back. Once the bottom is in, you know the next logical step is a change of trend. It can take some time before the low settles; the low is process not a one-day event. But here it settled already and this is all we need to know that the bullish bias is fully confirmed. You can now enter KASUSDT with lev while resting easy.
Good evening my fellow Cryptocurrency trader, I hope you are having a wonderful day.
The first low happened 10-March and then a lower and final low 7-April, also a technical double-bottom. Here Kaspa produces a small reaction and grows 150%. Notice that growing 150% in 30 days is small in the Crypto-world. If you were trading conventional markets, you would have to wait 10 years to get 70% growth.
Anyway, the initial bullish reaction to confirm the end of the correction goes into retrace and 16-June (the week), 22-June specifically, the market produces a higher low. This is the final retrace before maximum growth. I mean, there will be retraces and corrections in the future but the wave that is about to start now will not be 150%, it can be much bigger and last a lot longer, this is the 2025 bull market bullish phase. It will be a major wave.
This is just a friendly reminder to let you know, you can go all-in.
Thanks a lot for your continued support.
You will be happy with the results.
Namaste.

Resistance is claerly there, just takeitIt just so obvious the delta is there, resistance, just take the trade

KASUSDT Analysis (30-Minute Timeframe) Key Levels on the Chart:
Broken Resistance Turned Support:
Around the 0.07520 – 0.07600 zone, there was a significant resistance area that has now been broken and is acting as new support (shown as a red box on the chart). Price broke above it with a strong candle and is currently consolidating above this zone.
Current Price Level:
The current price shown on the chart is 0.07647, sitting above the new support zone. This indicates buyers are still in control in the short term.
Target Area:
The green box on the chart marks a potential target zone, approximately around 0.07900 – 0.08000.
Stop Loss:
The stop-loss zone is set below the support area (within the red box), likely around 0.07520.
Technical Summary
The short-term trend on the 30-minute chart is bullish.
A confirmed breakout above resistance suggests potential continuation upward.
As long as price stays above ~0.07600, targets near 0.07900 – 0.08000 are reasonable.
A drop back below ~0.07520 would invalidate the bullish setup and could trigger a deeper correction.
Trading Perspective
✅ If you’re already in a long trade around 0.07620 – 0.07640:
Keep your stop-loss below 0.07520.
Reasonable target is 0.07900 – 0.08000.
If candles start closing weakly back below the support zone, consider exiting early.
⚠️ Important Note:
Volume was strong on the breakout candle but has decreased slightly afterward. If volume remains low, there’s a risk of a deeper pullback.
Since this is a lower timeframe, price can be volatile, so always manage your risk properly.

$KASUSDT Breaks Trendline #KAS
The price is moving within a descending channel on the 1-hour frame and is expected to break and continue upward.
We have a trend to stabilize above the 100 moving average once again.
We have a downtrend on the RSI indicator that supports the upward break.
We have a support area at the lower limit of the channel at 0.071500, acting as strong support from which the price can rebound.
Entry price: 0.075917
First target: 0.077955
Second target: 0.080166
Third target: 0.082746
To manage risk, don't forget stop loss and capital management.
When you reach the first target, save some profits and then change the stop order to an entry order.
For inquiries, please comment.
Thank you.
$KAS – Three Possible Scenarios in the Near FutureCSE:KAS – Three Possible Scenarios in the Near Future:
🔹 Optimistic: Growth up to $0.21
🔹 Conservative: Growth up to $0.13
🔹 Pessimistic: Decline to $0.035
🚨 Key Levels to Watch:
▪️ $0.075 — a breakout above this level in July could open the path to $0.10 – $0.11
▪️ $0.11 — a breakout above this level could open the path to $0.13
▪️ $0.13 — a breakout above this level could open the path to $0.15
▪️ $0.16 — a breakout above this level could open the path to $0.19
▪️ $0.19 — a breakout above this level could open the path to $0.20 – $0.21
▪️ $0.05 — falling to this level may indicate further downside to $0.035

KAS IS TESTING RED RESISTANCE ZONE🚨 KAS Testing Red Resistance – Waiting for Breakout 📈
KAS is currently testing the red resistance zone.
If breakout is confirmed, the first target could be the green line level! 📊

Technical Analysis (KASPA/USDT - Daily Chart)Technical Analysis (KASPA/USDT - Daily Chart)
Trend & Structure Overview
KASPA has been in a prolonged downtrend after peaking near $0.22.
The Elliott Wave structure indicates a completed (A)-(B)-(C) correction pattern after a prior bullish wave (4).
Price is currently testing a triple bottom structure near $0.060–$0.065, highlighted by orange circles. This zone has previously acted as strong support.
Key Support and Resistance Levels
Type Price Zone (USDT)
Strong Support $0.060 – $0.065
Intermediate Resistance $0.080 – $0.085
Major Resistance $0.100 – $0.105
Upper Resistance Zones $0.120, $0.140, $0.160, $0.180, $0.200
The price is currently bouncing from the lower bound of this key support zone.
Indicators Summary
RSI (14):
Current: ~32.2 → Approaching oversold territory, signaling potential reversal or bounce.
Stochastic RSI:
Current: ~19.3 and crossing up, suggesting a bullish reversal signal forming.
Money Flow Index (MFI):
Value: 23 → Indicates weak inflows, but any spike could confirm a bottom formation.
VMC Cipher B:
Multiple green dots and momentum waves bottoming → Suggests bullish divergence and possible accumulation.
Volume:
No clear breakout volume yet, but prior bounce zones had relatively stronger support volume.
Trading Plan for KASPA/USDT
Entry Strategy
Primary Long Entry Zone: $0.060 – $0.065 (Current support region)
Entry Confirmation:
RSI holding above 30
Stochastic RSI bullish cross
Price maintaining above $0.065 on a daily close
Targets (Take Profit Levels)
TP Level Price Target (USDT) Rationale
TP1 $0.080 Nearest horizontal resistance
TP2 $0.100 Psychological level & prior S/R
TP3 $0.120 Top of major cluster
TP4 $0.140 – $0.160 Mid-term swing high zone
Stop-Loss Strategy
Conservative SL: Below $0.058 (breakdown of key support)
Aggressive SL: Below $0.0615 (to avoid wicks)
Risk/Reward Assessment
Risk from entry ($0.065) to SL ($0.058): ~10.8%
Potential reward to TP1 ($0.080): ~23%
R/R Ratio to TP1: ~2.1
R/R to TP3 ($0.120): ~8.5+
Alternative Scenarios
If KASPA breaks below $0.058 with volume:
Re-evaluate long positions
Possible next demand zone: $0.040 – $0.050
If volume increases on the bounce and breaks $0.085:
Add to position or open swing trade toward $0.100+
Summary
Current Bias: Cautiously Bullish
Setup Type: Support Bounce / Reversal Play
Key is holding above the triple bottom, while indicators point toward a possible short-term trend reversal.
Watch volume and momentum confirmation closely.

KAS 0.53 ZONE IS BEST SUPPORTBINANCE:KASUSDT.P is right now facing heavy selling pressure, should plan at 0.052-0.054 zone, not a financial advise, DYOR

KAS-USDT (Bybit spot), 4-hour candles TA+Trade plan1. Market context & chart structure
Asset / venue / timeframe: KAS-USDT (Bybit spot), 4-hour candles, data to 12 Jun 2025 06:45 UTC (see image).
Primary pattern in play: Price has compressed into a contracting (symmetrical) triangle that began after the 28 May low. The apex is only ~1–2 candles away, so a decisive break is statistically imminent.
Preceding structure:
17-day descending channel → capitulation into a falling-wedge reversal (27–28 May).
Two-legged double-bottom (“Bottom 2”) at 0.075–0.078 USDT.
Sideways rectangle 29 May-7 Jun, now morphing into the present triangle.
Key horizontal levels (4 h closes): 0.0930 (upper triangle rail / neckline) · 0.0891 (local supply) · 0.0797 (strong demand / wedge base) · 0.0620 (monthly support)
Volume picture: Realised volume has been drying up since 31 May, a classic pre-breakout contraction. A spike on the break will confirm direction.
2. Indicator read-out
Market Cipher B - Green momentum wave printing, money-flow bars just turned positive Mildly bullish, Early bull divergence vs 28 May
RSI(14) - 46 and curling up - Neutral-to-bullish Hidden bullish divergence vs price higher-lows
Stoch RSI 26/24 and crossing up from oversold Bullish Momentum reset complete
ArTy Money-Flow Index +3.5 and rising Bullish Positive inflow after five sessions of outflow
Collectively the oscillators favour an upside resolution, provided volume confirms.
3. Scenario probability matrix
Scenario Trigger & confirmation
Option 1 – Uptrend continuation
4 h close ≥ 0.0925 USDT with volume ≥ 2× 20-period average
Measured-move 0.107 → 0.118;
extended fib 1.618 ≈ 0.125–0.128
Est. probability: 60 %
Option 2 – Downtrend resumption
4 h close ≤ 0.079 USDT with similar volume spike 0.072 (range EQ) → 0.067–0.062 structural support
Est. probability: 40 %
Weighting derives from: oscillator bias, shrinking supply above 0.092 (order-book heat-map), but tempered by external models calling for a short-term dip toward 0.067 USDT
4. Trading plan
Component Long (Option 1) Short (Option 2)
Entry Buy stop 0.0926 USDT Sell stop 0.0789 USDT
Initial stop-loss 0.0838 USDT 0.0870 USDT (back inside triangle)
Primary target-1 0.1050 (≈1R) 0.0725 (≈1R)
Secondary target-2 0.1180 (≈2.5R) 0.0670 (≈2.5R)
Position size Risk ≤ 1 % of account per trade (adjust contracts accordingly)
5. Additional catalysts & risk factors
Macro-beta: BTC dominance and broad market risk-on / risk-off could swamp pattern-based setups; monitor DXY and SPX correlations.
Protocol news: Kaspa’s DAG-based roadmap upgrades and potential exchange listings remain upside catalysts. Conversely, lack of progress or regulatory headlines could accelerate a downside break.
kaspa.org
Weekend liquidity gaps: KAS often shows slippage outside US trading hours; consider reducing size or using wide stops if breakout occurs late Friday–Sunday.
6. To sum up
Bias: I lean 60 % toward Option 1 (bullish breakout) provided we get a 4 h close above 0.092 with volume confirmation. Otherwise, a flush to the 0.07 area (Option 2) is the alternative. Trade the break, not the prediction, and keep risk tight.

TradeCityPro | KAS Ranges Near Top with Bullish Momentum Rising👋 Welcome to TradeCity Pro!
In this analysis, I want to review the coin KAS for you. It’s one of the Layer One projects, and its token currently ranks 40 on CoinMarketCap with a market cap of 2.35 billion dollars.
⏳ 4-Hour Timeframe
On the four hour timeframe, the price is moving inside a range box between the levels of 0.082767 (which I’ve also marked as a zone) and 0.091126, and is currently near the top of the box.
✔️ Considering that other coins and market indexes like Bitcoin and Total2 are showing bullish confirmations, the activation of this coin’s long trigger could initiate a strong upward move.
📊 The volume increase shown on the chart is another reason why the probability of breaking the top of the box has gone up.
📈 For a long position, we can enter with the trigger at 0.091126. If the breakout candle comes with strong volume, we’ll have volume confirmation as well, and momentum confirmation will come from RSI breaking above 62.96.
✨ Given the confirmations, the likelihood of this trigger activating seems high, and we can target a move to 0.102417 or even 0.126033.
🛒 For a spot buy of this coin, it’s better to wait for a break above 0.126033. We can open a futures position at the 0.091126 trigger aiming for 0.126033, and once the price reaches 0.126033, we can use the profits from the futures trade to enter the spot market.
🔽 As for bearish movement and a short trigger, the first sign would be rejection from the 0.091126 area. The main trend reversal trigger will be the breakdown of the support zone.
📝 Final Thoughts
This analysis reflects our opinions and is not financial advice.
Share your thoughts in the comments, and don’t forget to share this analysis with your friends! ❤️

KAS AccumulationI am looking for an distribution model 1 to complete a bigger accumulation model 1 or 2 on KAS.

Kaspa reversal here is necessary. CHOCH incoming?KAS is slowly building a structure. This support here is very necessary, without it, a continued downtrend would stress liquidity levels below. Momentum and trend oscillators seem to have a bit more negativity left to make the price fall more; however, as the price reaches closer to invalidation, RR improves.
Full TA: Link in the BIO

KAS/USDT Analysis (4H/1H)1️⃣ 🟢 KAS/USDT
KAS/USDT found a bottom at 0.0831 USDT and is now tracing a quick five-wave rally. A clean 4H candle close above 0.0875 USDT flips the bias bullish. First target: 0.0901 USDT. 🚀✨
2️⃣ Wave Structure
• Wave (1) peaked near 0.0872 USDT
• Wave (2) held at 0.0831 USDT (strong flip)
• Wave (3) climbed toward 0.0880 USDT
• Wave (4) pulled back to 0.0862 USDT (higher low!)
• Wave (5) projects up to 0.0925–0.0930 USDT once 0.0875 breaks
3️⃣ Key Levels
• 0.0831 USDT – Wave (2) support (pivot) ✅
• 0.0862 USDT – Wave (4) higher-low 💪
• 0.0875 USDT – 4H trendline resistance ⚠️
• 0.0877–0.0880 USDT – resistance zone (former support)
• 0.0901 USDT – first profit zone 🔥
• 0.0925–0.0930 USDT – Wave (5) extension 🎯
4️⃣ Indicators
• 4H MACD: still slightly negative but histogram flattening → bears weakening
• 1H MACD: just crossed bullish → short-term upside momentum ✅
• If 1H MACD stays positive as price hits 0.0875, expect a quick breakout
5️⃣ Trade Plan
• Entry: Wait for a 4H candle close above 0.0875 USDT. Confirm on 1H that price stays above.
• Long near 0.0877–0.0880 USDT.
• Stop Loss under 0.0855 USDT (below Wave (4) at 0.0862).
• TP 1: 0.0901 USDT (take 50% off).
• TP 2: 0.0925–0.0930 USDT (exit remaining).
6️⃣ Invalidation
If price closes below 0.0831 USDT on 4H, the bull count fails. Risk shifts down toward 0.0796 USDT. 🚨
7️⃣ Aggressive Entry (ADHD-Friendly Tip)
• Start a small long at 0.0862–0.0864 USDT (Wave (4)).
• Tight stop under 0.0855 USDT.
• Add more once 0.0877 USDT flips.
8️⃣ Quick Signals to Watch
• 4H close > 0.0875 USDT → GO! 🟢
• 1H candle stays above 0.0875 USDT → Confirm!
• 1H MACD histogram positive → Keep it rolling!
9️⃣ Bullmaster Conclusion
“KAS/USDT shows textbook 5-wave structure off the 0.0831 pivot. With a higher-low into 0.0862 and bullish MACD on the 1 hour, the path of least resistance is up, provided we break the 4 hour descending trendline at 0.0875–0.0880. Our first target is 0.0901, where momentum may pause, but a sustained rally could carry us into the 0.0925–0.0930 zone. A stop under 0.0855 protects the setup—bulls look ready to flip control.”
🔟 Next 8 Hours (Zoomed-In OR in a nutshell )
• Watch for 1H MACD staying green → fuels the bounce into 0.0875
• If 1H price holds > 0.0875, it’s a go→ 0.0901 then 0.0925!
• If price dips back under 0.0862 on 1H → abort mission; bears still in charge.
Let’s keep it simple, stay focused, and ride those bullish waves! 🌊🐂✨

TECHNICAL ANALYSIS – KASPA/USDT (Daily Chart) + TRADE PLANTECHNICAL ANALYSIS – KASPA/USDT (Daily Chart)
Chart Pattern & Price Action:
Descending Channel (Falling Wedge): KASPA has been trading within a falling wedge pattern, typically a bullish reversal setup.
Breakout Zone Approaching: Price is currently testing the upper resistance of the wedge (~$0.086–$0.088). A breakout from this level may indicate trend reversal.
Key Resistance Zone:
$0.105 – $0.127: Significant supply area (marked in red). Previously rejected, it is the next target if price breaks out upward.
Support Zone:
$0.073 – $0.082: Demand zone. Coincides with the Bollinger Band lower range and historical support.
Indicators Overview:
Bollinger Bands:
Price is trading at or near the middle band, showing a neutral-to-slightly bearish bias.
A breakout above the upper band (~$0.0895) could trigger bullish momentum.
MACD (VMC Cipher_B_Divergences):
Strong bearish momentum continues, but we can observe potential bullish divergence forming.
Green dot signal at the bottom may indicate a possible local bottom.
RSI (Relative Strength Index):
Currently at 37.06, near oversold territory.
Could signal a bounce if RSI climbs above 40 and confirms strength.
Money Flow Index (Art’ Money Flow):
MFI is deep in negative; however, these levels often precede trend reversals.
Watch for a crossover into positive territory as confirmation.
Stochastic RSI:
Bullish crossover around 14.53 / 15.67 in the oversold zone.
Early sign of potential short-term bounce.
TRADING PLAN
Entry Points:
Zone Type Price Range Reason
Buy Spot 1 Conservative $0.073 – $0.082 Strong historical support & bottom of wedge
Buy Spot 2 Aggressive ~$0.086 – $0.089 Breakout of descending wedge
Buy Spot 3 Momentum Break above $0.105 Bullish confirmation + breakout of major resistance
Take Profit Zones:
TP Level Price Notes
TP1 $0.105 First resistance / psychological level
TP2 $0.127 Strong resistance – expect rejection here
TP3 $0.15–0.16 Major extension target if strong momentum
Stop-Loss Strategy:
Strategy Type Placement
Conservative Below $0.073
Aggressive Below $0.080
Risk Management:
Use position sizing relative to account size (e.g., 1–3% risk per trade).
Adjust stop-loss dynamically if entering at breakout.
Combine with on-chain metrics or volume spikes for higher conviction.
SCENARIOS:
🔼 Bullish Scenario (Blue Up Arrow):
Breakout above wedge → retest → rally toward $0.105+
Break $0.105 confirms macro uptrend continuation
🔽 Bearish Scenario (Blue Down Arrow):
Rejection at wedge top → breakdown of $0.082 → revisit $0.073 support
Below $0.073 would invalidate short-term bullish structure
