Kaspa Origin Trends X-Axis & Y-AxisThis chart illustrates the original trend lines for the Kaspa chart. There are two primary trends: a Y-axis support trend line and an X-axis resistance trend line. These trends are thought to be influenced by emission and halving schedules, resulting in recurring patterns.
KASUSDT trade ideas

Kaspa Origin Trend Lines X-Axis & Y-AxisThis chart illustrates the original trend lines for the Kaspa chart. There are two primary trends: a Y-axis support trend line and an X-axis resistance trend line. These trends are thought to be influenced by emission and halving schedules, resulting in recurring patterns.

Kaspa Origin Trend Lines -Jesse&AiThis chart illustrates the original trend lines for the Kaspa chart. There are two primary trends: a Y-axis support trend line and an X-axis resistance trend line. These trends are thought to be influenced by emission and halving schedules, resulting in recurring patterns.

KAS || kaspa big drop 🩸 is coming Pls 🙏 do your own research 🔎
Just casual view 🙂 on CRYPTO:KASUSD
🗝️ There was bearish 📍 & 📍 bullish wolf theory 📍 hidden in present developed chart 📉📈
I am expecting bearish reversal from resistance $0.085 - $0.14 range 📍
Present we can't confirm drop 🩸 based on top 🔝 we can confirm 👌 but my assumption
Bearish wolf wave green 💚 box 📍 60% above drop 🩸 expecting
Successfully we entered phase 1 📌 bull run 🐂
I explained details clearing how bull goes in 4phases
My view on KASPA gainers list coin 📌
What ur thoughts 💭 let me know 🥰

⚖️ KAS Consolidation Play! 📈💎📊 Analysis:
Consolidation at Support: KAS is consolidating at support, hinting at potential upward movement.
Retracement: Recent retracement in the past two weeks suggests a possible setup for another upward leg.
Ladder into Spot Long: Consider laddering into a spot long trade in the current $0.0144 - $0.0155 support area.
Take Profit Strategy: Plan to sell 25% at the next resistance area from $0.183 - $0.19 and let the remainder run.
Stop Loss: Set a stop loss just below $0.14 for risk management.
🌐 Note: Keep an eye on broader market trends and any upcoming events that may impact KAS.

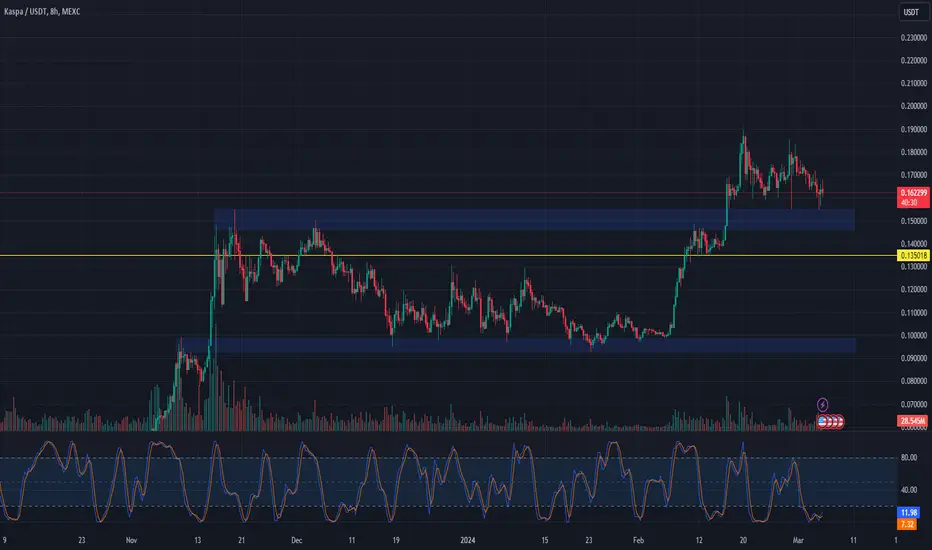
🚀 KAS Support Hold: Potential for Higher Levels! 📈💹📊 Analysis:
Current Situation: KAS is holding support above $0.15.
Retest Scenario: If it holds on the retest, higher levels could be on the horizon.
📉 Trade Strategy:
Entry: Consider entering the trade between $0.14 and $0.15 support area.
Stop Loss: Set under $0.135 to manage risk.
Take Profit: Aim for higher levels around $0.20 or $0.25.
Kaspa Update: Navigating Fibonacci LevelsTraders, quick update on Kaspa's journey: We've entered the golden buy zone, hitting the 0 on our Fibonacci retracement. Excitement's building as we await the -.382, -.618, and -1.6 levels. Stay tuned for the next moves!

$KAS Huge Cup and Handle?CRYPTOCAP:KAS has played out several smaller cup-and-handle patters over the past year. This idea shows two larger cup-and-handle patterns on the $KAS/BTC pair - one which played out already (yellow) and one that could be leading up to a breakout.
If this breakout occurs, it could shoot KAS*1,000,000/BTC from ~3.0 to 5.0 - 5.5. at ~$60k BTC, that's $0.30 - $0.33 per $KAS. Very fair target considering others' recent models.
Where things could turn really juicy, is if BTC continues to rip and closes in on $90-100k... in that case, the target CRYPTOCAP:KAS price range is $0.45 - 0.55.
Good luck!!
CRYPTOCAP:KAS , COINEX:KASBTC

KAS Token : what Do You Think?According to the chart, we have a good reaction to the 61.8 Fibonacci tool.
You can wait for the confirmation candle to enter the desired position.
This is a personal opinion.

Fib Retracement, and RSI Double Bottom Confirmation KASPAIntegrate the concept of the Golden Buy Zone between the .5 and 0.618 Fibonacci retracement levels and emphasize the importance of observing a double bottom on RSI before making buying decisions:
**Introduction:**
The Kaspa coin has attracted traders, and by combining Fibonacci retracement with the Relative Strength Index (RSI), an advanced strategy emerges for technical analysis. This approach aims to precisely identify potential reversal levels, introduces the concept of the Golden Buy Zone, and stresses the significance of observing a double bottom on RSI before making buying decisions.
Components of the Strategy:
1. Fibonacci Retracement:
- Identify a recent significant price move on the Kaspa coin chart.
- Apply Fibonacci retracement levels (including 1.618, 1, 0.618, -0.618, -0.382, 0.618, 0.5, 0.382, and 0) to the price chart to pinpoint potential support and resistance levels.
2. Golden Buy Zone:
- Recognize the area between the .5 and 0.618 Fibonacci retracement levels as the Golden Buy Zone. This zone is considered a strong buying area.
3. RSI Confirmation:
- Use the RSI indicator to evaluate the strength of Kaspa coin's price movements.
- When the Kaspa coin price hits a Fibonacci retracement level, check the corresponding RSI value.
- Look for divergence or convergence between the price action and RSI readings. Especially, observe a double bottom on RSI before considering buy actions.
Trading Signals:
1. Fibonacci Support/Resistance Levels:
- Buy signals: Look for buying opportunities within the Golden Buy Zone (between .5 and 0.618 Fibonacci levels), especially if the RSI indicates oversold conditions and shows a double bottom pattern.
- Sell signals: Consider selling when the Kaspa coin approaches a Fibonacci resistance level, particularly if the RSI suggests overbought conditions.
2. RSI Confirmation:
- Bullish confirmation: If the Kaspa coin bounces off a Fibonacci support level within the Golden Buy Zone and the RSI shows oversold conditions with a double bottom, it may signal a potential upward trend.
- Bearish confirmation: If the Kaspa coin approaches a Fibonacci resistance level, and the RSI indicates overbought conditions, it might suggest an upcoming reversal or correction.
Risk Management:
- Set stop-loss orders below Fibonacci support levels for buy trades and above Fibonacci resistance levels for sell trades.
- Consider position size based on risk tolerance and overall market conditions.
Conclusion:
This advanced strategy, incorporating the Golden Buy Zone and RSI double bottom confirmation, provides a more nuanced approach to trading Kaspa coin. By adding these elements, you enhance your ability to identify optimal buying opportunities and make informed trading decisions. Adapt and refine the approach based on ongoing market observations and evolving trends.

Crypto Surge: Navigating Kaspa's Momentum and Fibonacci Signals Keeping a close eye on Kaspa! The recent surge, a whopping 20% in just 7 hours, indicates some serious momentum. Still riding the ATH wave, and the Fibonacci analysis suggests that hitting the -.618 might be the key for the next leg up. The last 7 hours showing an 11.1% rise - exciting times! Additionally, the RSI is now moving above the MA, adding more bullish signals. Let's see if Kaspa continues to ride the upward trend. CryptoInsights KaspaJourney MarketAnalysis


KAS bullish scenariosThis is probably the bit weird one but here it goes.
Case 1: KAS looks to be in the timing bad of where a low is put in and in case we are there then I would target the 0.4-0.5 area for the next top.
Case 2: If however price decides to do go deeper for a 50% or 70% retrace then I would lower the next ATH target to about 0.2 area.
Looking at the history we have with KAS I'd say that first scenario is more probable than the second.

#KASPA is primed to move?The prior ATH will be area of great battle between the bulls and bears
Bears may assume the run is over and a double top is in play
Bulls are looking for continuation after a long consolidation period
I favour continuation!

KAS/USDTI'm excited to share a technical analysis of KAS/USDT, where the project Kaspa introduces a revolutionary blockDAG structure based on the GhostDAG/PHANTOM protocol. This innovative approach makes Kaspa the fastest and most scalable instant confirmation transaction layer built on a proof-of-work engine.
Key Project Information:
Coin: KAS/USDT
Project: Kaspa, employing the GhostDAG/PHANTOM protocol
Structure: BlockDAG, a groundbreaking ledger structure
Consensus: Scalable generalization of Nakamoto Consensus
Technical Analysis:
As illustrated in the chart below:
Monthly Open Price: $0.1280
Weekly Open Price: $0.1060
Monday Highest Price: $0.1090
Monday Low Price: $0.095 (a significant level triggering a market response)
Trade Plan:
Buy Levels: $0.11300 and $0.11900
Stop Area: $0.10, up to Monday's low at $0.095
First Target: $0.13700 (20% potential gain)
Second Main Target: $0.18500 (60% potential gain)
The trend is expected to turn bullish upon breaking the $0.1200 level, paving the way for further upside potential.
Remember, this is not trading advice but an analysis for your consideration. Enjoy the run, stay safe, and may everyone reap profitable rewards.

KASPA Completing?If you find this information inspiring/helpful, please consider a boost and follow! Any questions or comments, please leave a comment!
CRYPTOCAP:KAS
New one for me, looks pretty clean here.
Not jumping in on this now, no trigger for me.
But watching how things progress, for a clarity entry.


KASPA price prediction short-termIs kaspa will make .183 before retracing or it will go down to .145 before pumping again :)

KASPA (KAS/USDT) Soars to New HeightsTechnical Analysis:
KASPA (KAS/USDT) has emerged as a remarkable player in the cryptocurrency landscape, exhibiting sustained growth and resilience. The recent patterns observed in its charts underscore both its potential and the keen interest of investors.
1. Fair Value Gap (FVG) and Price Rebound:
KASPA's journey through the market has recently brought it to an important Fair Value Gap (FVG) area. This FVG, often seen as a critical juncture in price action, was met with a robust response as the price rebounded from it. This rebound is not just a random fluctuation but a strong indicator of underlying market confidence and investor interest.
2. Daily Exponential Moving Average (EMA) Cross:
Coinciding with the rebound from the FVG, a daily EMA cross has been confirmed. This is a significant technical event, as Daily EMA crosses are often used to identify potential trend reversals or confirmations. In KASPA's case, this Daily EMA cross suggests a strengthening of the bullish trend, adding more credibility to the ongoing upward movement.
3. Breaching the All-Time High (ATH):
Adding to the bullish sentiment, KASPA has, for the first time, broken past its All-Time High (ATH). This breach is not just a milestone but also a testament to the growing trust and optimism among investors regarding KASPA's future.
Fibonacci Extension Targets:
Utilizing the Fibonacci extension tool, we can project potential future price targets for KASPA. The calculated targets are as follows:
First Target @1.618 Fibonacci Level: 0.324933
Second Target @2.618 Fibonacci Level: 0.467368
Third Target @3.618 Fibonacci Level: 0.612101
Fourth Target @4.236 Fibonacci Level: 0.699502
These targets provide a roadmap for where KASPA's price could head next, assuming the continuation of the current trend and market dynamics.
Fundamentals Analysis:
In the last 30 days, KASPA has not only made waves in the technical charts but also strengthened its fundamental position.
Recent Developments and Partnerships:
KASPA has recently announced several key partnerships, further integrating its technology into broader applications. These partnerships, focusing on areas like decentralized finance (DeFi) and non-fungible tokens (NFTs), are crucial for expanding KASPA's ecosystem and increasing its utility.
Community and Developer Engagement:
The project has seen a surge in community involvement and developer activity. The introduction of new tools and platforms for developers, along with community-driven initiatives, has fostered a more robust and active ecosystem. This increase in engagement is a positive sign, indicating a growing and dedicated user base.
Regulatory Compliance and Security Measures:
KASPA has also been proactive in ensuring regulatory compliance, a key factor in sustaining long-term growth. The team has taken steps to adhere to evolving global regulations, enhancing investor confidence. Additionally, security measures have been strengthened to protect against potential threats and vulnerabilities.
Market Sentiment and Investor Interest:
The overall market sentiment towards KASPA remains positive. Increasing investor interest, as evidenced by social media activity and cryptocurrency forums, suggests a bullish outlook. This sentiment is bolstered by KASPA's consistent performance and strategic initiatives aimed at long-term growth.
In conclusion, KASPA's technical and fundamental analysis paints a picture of a cryptocurrency with strong potential, backed by a robust ecosystem and growing investor confidence. The synergy of technical strengths and solid fundamentals positions KASPA favorably for future growth. However, as with any investment, market dynamics and external factors could influence its trajectory.

Pop or a drop?Looks like a H&S on the 1hr
Volume has depleted since initial peak.
On the other hand, it has been defying all deviations on 3m chart and seems to have a bullish bias. The bears are gone hiding, as the RSI is extremely overbought.
Asking for a friend ;) Please discuss!

KAS/USDT: A Tale of Two Patterns - bullish or bearish?The KAS/USDT chart shows an interesting development with a possible double top or bull flag formation. There's a chance the price could reach .50 based on technical analysis, but remember that the crypto market is volatile and reaching this target is not guaranteed.

Kaspa breakoutKAS broke out to new all time high from a 3 month-long consolidation. Target for this move is between 0.20-0.45

Double top on KASPA KASPA coin (kas) formed a double top on the weekly
We can either see a break of the resistance and then retest to go higher
OR we can expect a test of the bullish trendline and then move higher
Overall it will all depend on how BTC moves.
