KASUSDT trade ideas

KASPA - Okay then time to decisionKaspa continues its movement in an ascending triangle. A new increase or decrease?
Kaspa – Short Term correction on LTFI am uploading early to give you time to consider and prepare.
KAS fulfilled Miller’s (2020) three M.S Principles of a bullish to bearish reversal:
1. The market fails to create a higher high.
2. Price makes a LL (price breaks the X line)
3. Price makes another LH in which B > E.
Final confirmation is only if KAS makes another LL.
I consider this a healthy correction within a bullish trend. As long as Kaspa stays above 0.041, it is bullish on the daily TF. Ideally it won’t retrace lower than 0.062.
Risk Level:
High Risk.
Reasons:
1. Counter trend trade.
2. R: R: to first TP less than 1:3.
3. Final confirmation only if KAS makes another LL.
Trade Idea:
Entry: 0.0833
SL: 0.091
Target: 0.053
TP: 0.066 0.0533
R: R: 1:2.2 to first TP
If you don’t have a position, you can use the demand zone and TPs to accumulate.

The future of KASPA In the following analysis over a weekly date range
We notice that there is a possibility of continuing the rise of KASPA
At the beginning of the new year, we may notice a decrease

KASPA vs USDT - KASUSDT IdeaKUCOIN:KASUSDT MEXC:KASUSDT
⚠️ Disclaimer: The following insights reflect my personal perspective on the market, relying on publicly available information and historical data. While some opinions stem from my actual trades, others do not. I am not a financial advisor, and I bear no responsibility for your trading choices.
✅ Feel free to reach me out with any questions or recommendations. I am more than willing to assess and analyze any currency pair or index that piques your interest.

KASPA middle term targetsMEXC:KASUSDT
Possible Targets and explanation idea
➡️Since summer 2022 KAS gain over 25000% without corrections
➡️Since listing on MEXC we are only in distribution zones on weekly
➡️Waiting potential small correction and pump to 0.5 extension fib level 0.06
➡️Forming divergency and TD pattern before massive correction after October/November
➡️In accumulation zone to everyone who wanna buy again will be time for accumulation
➡️At 0.06 people who bought at listing price will be in 12000% gains profit.
Hope you enjoyed the content I created, You can support with your likes and comments this idea so more people can watch!
✅Disclaimer: Please be aware of the risks involved in trading. This idea was made for educational purposes only not for financial Investment Purposes.
---
• Look at my ideas about interesting altcoins in the related section down below ↓
• For more ideas please hit "Like" and "Follow"!

KASPA - Time To Say Goodbye (Andrea Bocelli)Kaspa came back to the resistance where it was constantly rejected and managed to close the hourly candle above the resistance. Let's see if it can break the blue wedge and erase a zero.

KASPA, KASUSDT IdeaKUCOIN:KASUSDT MEXC:KASUSDT
⚠️ Disclaimer: The following insights reflect my personal perspective on the market, relying on publicly available information and historical data. While some opinions stem from my actual trades, others do not. I am not a financial advisor, and I bear no responsibility for your trading choices.
✅ Feel free to reach me out with any questions or recommendations. I am more than willing to assess and analyze any currency pair or index that piques your interest.

KASPA: $0.016 | waiting for Allocation or Gift a project that intends to be BITCOiN on speed
a community based decentralized...
or he who commands the community is the central authority
like how the chart moves is like under the direction of a CENTRAL POWER
so sexy S curve.. not decentralize but well regulated and managed
if its decentralized it should look like a drunken master
anyway it's got mining and a board aka consensus to make dcisions
float at large.. to designated early adoptors
am guessing depression to WEED OUT tourist and
corner the majority of float some more
for a bigger payout when this gets listed in you know where
note:
again like any issue.. there is always that invisible hand force aka the Specialist Handler Jockey that calls the shots
to inflict fear pain and ecstasy for the benefit of the FEW greedy folks

Kaspa- Inverse Head and Shoulders BreakoutKaspa formed an Inverse Head and Shoulders. Today (Nov. 4th) it broke above the neckline to form a new ATH.
The immediate target is 6.6 cents. However, we are at price discovery and the potential is much higher.
My advice: Don’t buy the breakout; buy the retest.
Trade idea:
Entry: 0.053 (neckline)
SL: 0.049 (Right shoulder and local support).
Target: 0.066
R: R: 1:2.93
Best Wishes

KASPA double cup and handle breakout imminent?Waiting for breakout above green line for confirmation.
Three tries previously before finally breaking out and going parabolic..

Kaspa Moon Maths.... could it perform as well as HEX?HEX did a 10,000x from its all-time lows to its ATH last cycle. Kaspa is similar in that it is a community-driven project based on solid fundamentals with limited exchange listings. A 10,000x on this chart would take it to $5. Is that even reasonable? Please let me know what you think.

Kas Elliott waves I expect a rejection from the designated area. The wave mentioned is the last wave, called «c»

$kas #kaspa -65% coming$kaspa from 0.0002 to 0.05 in just 1 year .
Huge correction is in the coming days . Min -65% (0.017-0.018)

KASPA very bearish..After my VERY SUCCESFUL prediction about Kaspa, im back again.
Kaspa is entering bearish period. As you can see with the latest breakout to ATH (0,054) Volume was even lower than previous times, which is absolutely bearish. After the breakout, KASPA immediatly dumped to 0,043, which is another bearish sign. It seems whales just wanted to exit and needed a little bit liquidity (which they are not getting).
Beside of this, You see Kaspa has made DOUBLE TOP, this is one of the most bearish patterns, I dont see Kaspa going any higher and i expect a huge dump towards at least 0,025.
BE CAREFUL.
My PREVIOUS prediction about Kaspa was PERFECT:
MEXC:KASUSDT KUCOIN:KASUSDT CRYPTO:KASUSD COINEX:KASUSDT

KAS/USDTand like magic $kas broke out and has a potential of a inverse head and shoulders pattern playing out, I have measured target.

KAS Lights the Path: Get In on the Buy Action Today!"**Kas Coin (KAS)** is a cryptocurrency that was launched in May 2023. It is a decentralized digital asset that is built on the Ethereum blockchain. KAS is designed to be a fast, secure, and affordable means of payment.
**Recent news:**
* On October 27, 2023, Kas Coin announced that it had partnered with Binance Pay, a leading cryptocurrency payment platform. This partnership will allow KAS users to make payments at over 80 million merchants worldwide using KAS.
* On October 29, 2023, Kas Coin announced that it had been listed on Coinbase Pro, a leading cryptocurrency exchange. This listing will make KAS more accessible to investors and traders around the world.
**Fundamental analysis:**
* Kas Coin has a total supply of 10 billion tokens.
* KAS is currently ranked #250 by market capitalization on CoinGecko.
* KAS is traded on several exchanges, including Binance, Coinbase Pro, and KuCoin.
**Disclaimer:**
This is not financial advice. Please do your own research before investing in any cryptocurrency.

Kaspa - Possible Short TradeIn my previous TV idea, I entertained the bullish case for KAS. While I cannot rule out a bullish breakout, evidence for a double top formation and a consequent drop is piling up.
Pros:
1. Kaspa is holding above the 21D & 50D EMAs. As long as the daily TF is bullish, I cannot rule out continuation to the upside.
Cons:
1. Although Kaspa made a HH, The RSI was showing a bearish divergence.
2. The RSI is showing a sharp decline in momentum. IMO, it shows that traders and investors are reluctant to buy or enter a long trade at this level.
3. The daily chart also shows a bearish divergence on the RSI.
4. KAS broke an upward sloping trend line (daily and the 4H). In my trading system a violation of a diagonal trend line is serious because the diagonal includes two axis’ time, and price. In my experience, whenever an asset breaks a diagonal, you can expect a drop to the origin of the move (at least).
5. If traders and investors were eager to get into a trade on Kaspa, Friday’s (September
22nd) presented a perfect entry:
A SF candle with 21D EMA holding support followed by retrace to the 61.8% of the wick
and a move back above the 0.045 level. However, there was no follow through! KAS
cannot break above the 21 and 50 EMAs on the 1H
7. The 1H and the 4H already show a bearish cross (21 and 50 EMAs). A bearish cross is not
important in and of itself but, it indicates a direction, and the direction is likely lower.
8. IMO, break below the 0.045 level and the 21D EMA confirms a Double top pattern.
9. On the 1H Kaspa is compressing in a triangle pattern which suggests continuation down.
10. Bearish Divergence on the 1H also suggests that the most likely direction is lower.
11. A word of caution, Triangles are notorious for fake outs. For me, a triangle is just
confluence. I don’t enter trades on the breakout of or, a break down from a triangle.
Trade Idea:
• Entry: 0.444 (retest of the 21D as resistance)
• SL: 0.0474 (above the 21D and 0.045)
• Target: 0.0333 (possibly lower)
• TP: 0.04 (demand zone), 0.0333
• R: R: 1: 3.83
NFA.
What do you think? Please share in the comments.
Best wishes

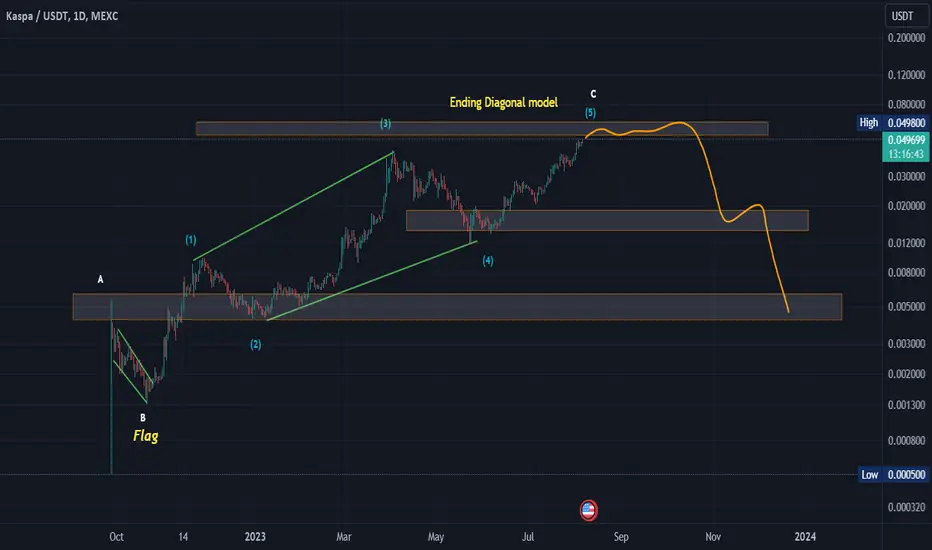
The ascent is almost finishedFrom the general shape and Elliott rules, a B-wave flag was formed, including the five-wave Ending Diagonal model. It is close to the end of the ascent, to begin the draining phase, and then descend to the shaded areas below.
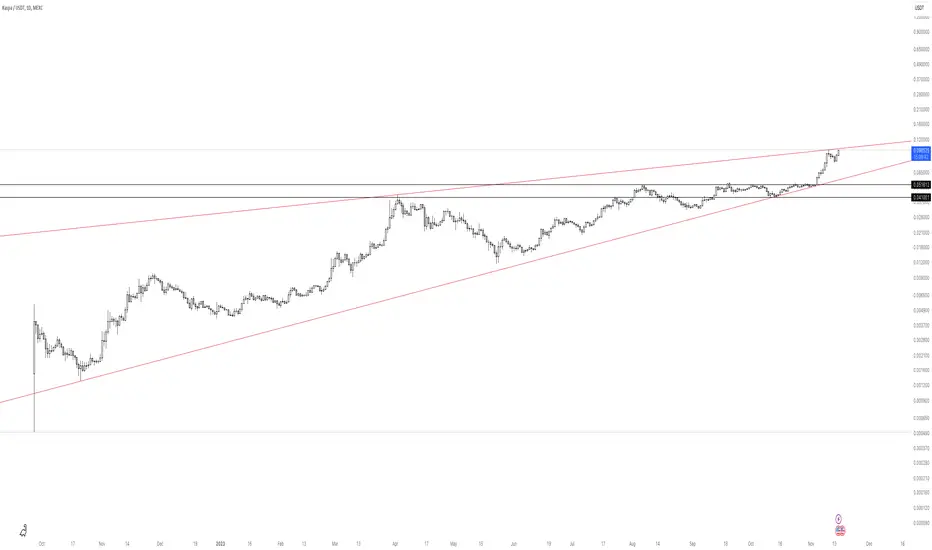
KASUSDT Ascending Triangle BreakoutKASUSDT Daily is about to break out of a nice ascending triangle pattern. A fairly new crypto so no overhead resistance. Also breakout coincides with a market cap of around 1 billion.


Kas is ready for a massif dumpas you can see there is a bearish divergence in the weekly frame
once the price breaks the white trend line the price will fall
im ready for your opinions

KAS MIGHT FALL : Bearish Divergence 📉 It's crucial to approach trading with a discerning eye. The KAS token has recently formed a significant rising wedge pattern, a bearish indicator, and to add to the complexity, it's showing signs of a bearish divergence. This double whammy serves as a warning to traders to exercise caution. 📊🚫
The Rising Wedge Pattern:
Rising wedges are typically bearish patterns, suggesting a potential price decrease. However, the crypto world is known for its unpredictability, so it's wise to be cautious. 📉🐻
Bearish Divergence:
Adding to the intrigue is the presence of a bearish divergence, where price forms higher highs while the corresponding oscillator (like RSI) creates lower highs. This phenomenon signals potential weakening in buying momentum. 📈📉
A Word of Caution:
It's crucial for traders to tread carefully when considering positions on KAS:
Risk Management: Employ rigorous risk management strategies, such as stop-loss orders, to safeguard your investments.
Thorough Research: Always conduct thorough research into the fundamentals and recent news related to KAS to make informed decisions.
Patient Entry: Should you consider short positions, exercise patience and wait for a confirmation of the bearish trend. This might involve a retest of the wedge border.
Conclusion:
The cryptocurrency market is known for its unique characteristics, and patterns can be informative, but they don't always guarantee outcomes.
Market dynamics, liquidity, and unpredictable events can influence prices, and traders should remain vigilant and adapt their strategies accordingly.
While the rising wedge and bearish divergence are worth noting, they are not the sole determinants of market movements. Trade wisely, and always be prepared for the unexpected.
Happy trading,
📉
❗️Get my 3 crypto trading indicators for FREE! Link below🔑
