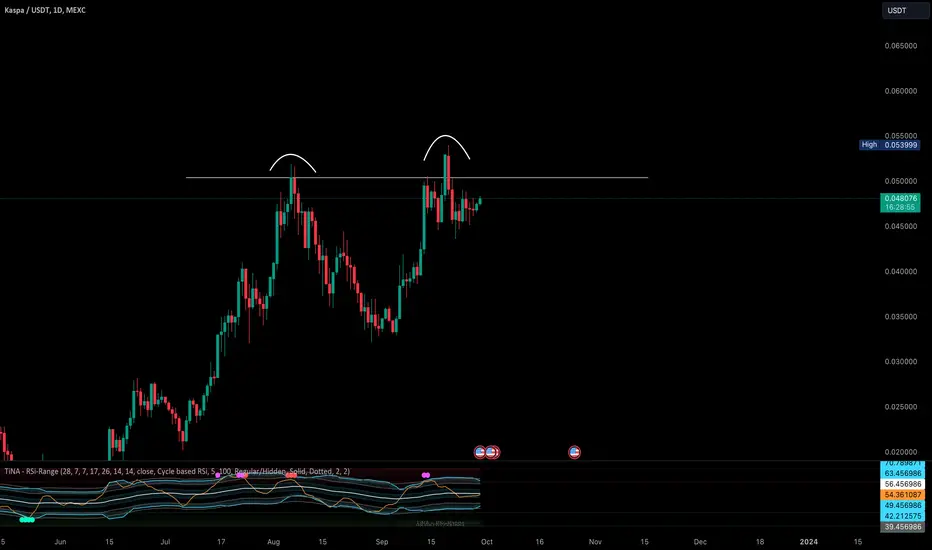
Kas/Usdt (Bearish Behavior) Confluences to short:
1. Breaking out of the rising Bear Flag (watching)
2. Head and Shoulder pattern (confirmed)
3. Bearish Divergence on WEEKLY (confirmed)
4. Closing and retesting below 50 days EMA (watching)
Will be updating you guys on step by step process, stay tuned.
NOTE: DON'T SHORT IT YET, WAIT FOR ALL THE CONFIRMATION. TRADE AT YOUR OWN RISK.
KASUSDT trade ideas

KASUSDT Elliott Waves Analysis (time to fall)Hello friends.
Please support my work by clicking the LIKE button👍(If you liked). Also i will appreciate for ur activity. Thank you!
Everything on the chart.
Entry: market and higher
Targets: 0.3 - 0.2 - 0.13
after first target reached move ur stop to breakeven
Stop: (depending of ur risk). ALWAYS follow ur RM .
risk is justified
Good luck everyone!
Follow me on TRADINGView, if you don't want to miss my next analysis or signals.
It's not financial advice.
Dont Forget, always make your own research before to trade my ideas!
Open to any questions and suggestions


Kaspa created a cup and handleNew ATH incoming please look closely as we bounce within the golden pocket from the orgin trend line using the fib channel. The KASPA cryptocurrency, as with other digital assets, has been experiencing a dynamic shift in its trend. It has seen significant fluctuations in its value, reflecting the inherent volatility of the cryptocurrency market. The current trend underscores the fact that while KASPA, like other cryptocurrencies, holds potential for high returns


Perfection is key, and the key = 0.039This will go down, we have the 4h stochastic at top and we are printing bear patterns all day long. Sell now or bleed together with all the newcommers. Get out now!!!!!!!!

Sell Kaspa right now at the top!It would be really smart to dump this coin now before you get dumped on by the early investors. There is a 99% chance we will dump down. 0.039 is coming hard and fast. Do not take this as advice, but this is why I am sitting in short right now. Would be a buyer again at the 0.028 level!

KAS may be topping out short termZooming out on the hourly chart on $KAS we are forming the exact same topping structure it formed at the beginning of August.
I would be very cautious going long at these levels, I think we could see a move back down to .036 before we continue our monumental bull run.
The volume has been decreasing over time as we reached the latest ATH.


#KAS/USDT breaking the Diagonal Trendline in 4-Hour TF! #KAS/USDT breaking the Diagonal Trendline in 4-Hour TF!
Wait for Breadown and retest to short $KAS. The major resistance level is $0.0505.

KAS New ATH this week?KASPA has been consolidating up against its previous ATH.
After a large rally coming off an ABC correction the asset has stalled at the ceiling of its previous ATH. To most traders surprise the asset continues to trade sideways instead of crumble in the face of its largest resistance.
I am currently tracking an ascending triangle on the 4HR chart and the Daily MACD also looks like it is getting ready to produce another wave of bullish bars.
I expect the break out to be relatively large but am going to stay on the sideline and rather trade the breakout confirmation once we flip the ATH to support.
Keep in mind the ATH for KAS is also the Market Cap Resistance of 1B Market Cap. Go long with caution.

KAS | LONG - ABC CorrectionKAS is one of the strongest coins in the bear market at this moment.
We just had our ABC correction and now the MACD-Histogram is showing a bullish divergence.
KAS corrected to the golden ratio on the Fib and order block.
All together, I'm looking for a long trade, keep risk low!

Ascending Triangle on KAS - BULLISHLooks like there's potential for KAS to form an ascending triangle here.
Could fill out the entire shape shown in this chart, or break out sooner than later.
My bias is that it doesn't get filled out completely, but we'll see...

kaspa repeat30 days 35% this is what the last reversal played out to and it is very possible we repeat this so i would wait for a bit more confirmation but it will become clear soon enough

How High Can Kaspa Go?ATM, it looks like Kaspa is on the verge of a breakout and a new ATH.
First, a word of caution. You should be bearish at resistance. If you want to trade this as a breakout trade, wait for confirmation. Meaning that you should wait for a S/R flip.
Regardless, the question is, if Kaspa does break out, ho high can it go?
To try and answer the question I will use the following tools:
1. The RSI as a momentum indicator.
2. Classical charting.
3. The Echo indicator by Lux Algo.
First, let’s have a look at the RSI:
• Weekly RSI is at 67. Bullish and not yet oversold. No bearish Div.
• Daily RSI is at 70. Hot, but it could go a lot higher before a pullback. No bearish Div.
• 4H RSI is at 72. Hot, but it too could go a lot higher. However, on the 4H we do have a
bearish divergence. Pay attention to that because it could lead to a pullback.
My conclusion is that there is almost no bearish momentum. Kaspa is bullish and far from being exhausted.
Classical Charting:
On the daily TF, it looks as if Kaspa is forming a cup and handle with a target of 7 cents.
There is additional confluence for this breakout from previous bullish patterns that you can see in the linked ideas.
Echo indicator by Lux Algo:
I changed the settings on the Echo indicator on the evaluation window and forecast window to 100.
Note that if I was using the default settings, the indicator’s prediction is a pullback to the 3.5 cents area. A possibility that is still very much on the table!
However, I examined the modified settings against my expectations for Bitcoin and other assets, and IMO, this is the most accurate.
According to the Echo indicator, Kaspa could go as high as 8.3 cents.
Please use risk management and remember that we are at resistance.
NFA.
What do you think? Please share in the comments.
Best Wishes.

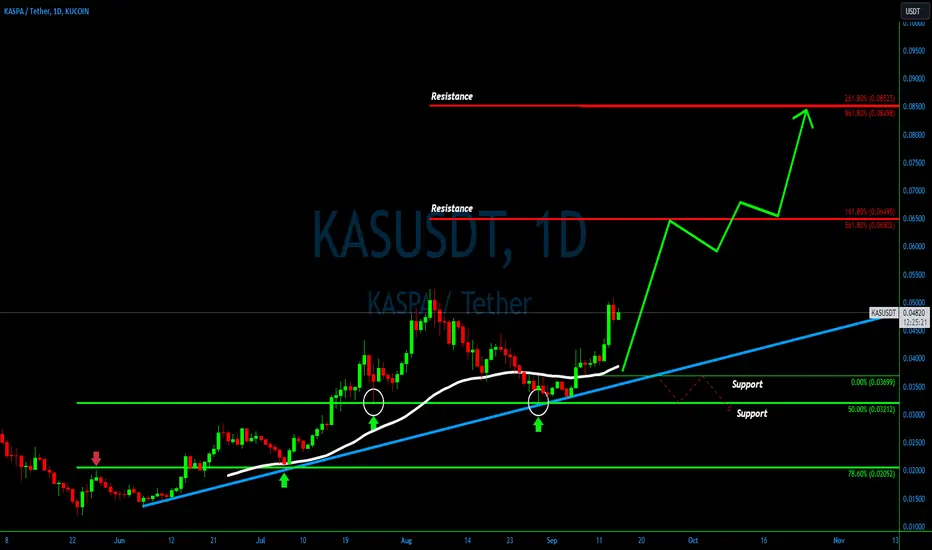
Charting the Path - KASUSDT Uptrend Story💎#KASUSDT has recently delivered an impressive performance, marking an almost 60% price surge since the month's commencement. This upward trajectory initiated following a bounce from the 50% Fibonacci support level at $0.032. Simultaneously, we observed a decisive rejection of the long-term uptrend trendline. These two pivotal events propelled the price upward, breaching the 50 Exponential Moving Average on the daily chart.
💎This price action underscores the credibility of a robust uptrend, significantly enhancing the likelihood of further growth. Consequently, #KASPA is poised to set its sights on one of the double Fibonacci resistance levels, situated at either $0.065 or $0.085.
💎However, prudent traders, or Paradisers as we like to call them, remain vigilant for opportune buying moments amidst the ascent. They avoid chasing the asset at its peak. Simultaneously, it's imperative to prepare for the scenario in which the price breaks below the recent support at $0.036. Such an occurrence would cast doubt on the continuation of the uptrend.
💎In light of these factors, implementing a sound money management strategy alongside clearly defined support and resistance levels is imperative for a well-rounded approach to trading.
KASUSDTKASUSDT is in strong bullish trend.
As the market is consistently printing new HHs and HLs.
currently the market is retracing a bit after last HH, which is also the 38% fib retracement level and the previous broken resistance might be turning as a support. if the market successfully sustain this bullish confluence the next leg high could be 0.05200.

It needs to happenThis needs to happen, this is a biased TA. I can not see the future, but I feel this happening, can not explain why.

KAS/USDT planning downward move? 👀 KASPA Today AnalysisParadisers, gear up for a compelling opportunity with KASUSDT! After experiencing a notable uptick, it now seems to be gearing up for a potential downward shift👀
💎In our previous observations, we noticed that what was once a supply zone has transformed into a demand area. The price disregarded the bearish Order Block and soared, only to face resistance at the 0.050924 level. KAS now hovering around a retest of the demand zone.
💎Interestingly, the price has failed to establish a new higher high, and buying pressure appears to be waning. This suggests that selling pressure could be imminent.
💎The fixed volume profile also indicates significant volume at our target level, where the price of KASPA may face rejection. Additionally, there's a bullish Order Block at this level.
Keep your charts updated and Stay one step ahead of the market 🌟 🌴

Red or Blue ?Hi there!
Situation is little complex.
We have two high probability scenarios.
-The Blue scenario is 12345 and smaller ABC to the 50 % Fibonacci retracement level
or as alternative it can be with bigger forming ABC to the 61.8 % Fibonnaci level!
In both of cases the next wave to the upside can be huge as big wave 3!
-The red scenario is 1234 and waiting for fifth wave! Also, we have a nice impulsive wave to the upside so after correction it can be continued to the upside as wave 5.
If market will be sideway, consolidate or temporary bullish we keep this scenario but if market turns strong bearish Kaspa can also erase this scenario!
Check S&P500 before you trade BTC, check BTC before you trade any Alt coin, is my moto!
Good luck traders.

Kaspa bull trend into its 3rd halving 2024Kaspa is proving to be a force to be reckoned with and many are starting to take notice. Kaspa is the child of Yonatan Sompolinsky who is a brilliant coder/programmer with an impressive Harvard degree in his field of expertise in cryptography. He has developed the very first BlockDag of its kind which is a more superior blockchain than what we know with Bitcoin. Please do your research and understand why this is so and you may learn to appreciate why this technological breakthrough that has taken nearly over 11 years in the making.
I using fib channels along with Beam bands and price points reflected by fib time zones. I am also using fractals for possible future price action. I may be wrong but if my estimates are correct we could possibly be seeing a price of $0.84 the month before the next halving which is on May 7th 2024.
Please take all this information with your own research and a grain of salt as all is highly speculative.
