KAS/USDT Analysis (4H/1H)1️⃣ 🟢 KAS/USDT
KAS/USDT found a bottom at 0.0831 USDT and is now tracing a quick five-wave rally. A clean 4H candle close above 0.0875 USDT flips the bias bullish. First target: 0.0901 USDT. 🚀✨
2️⃣ Wave Structure
• Wave (1) peaked near 0.0872 USDT
• Wave (2) held at 0.0831 USDT (strong flip)
• Wave (3) climbed toward 0.0880 USDT
• Wave (4) pulled back to 0.0862 USDT (higher low!)
• Wave (5) projects up to 0.0925–0.0930 USDT once 0.0875 breaks
3️⃣ Key Levels
• 0.0831 USDT – Wave (2) support (pivot) ✅
• 0.0862 USDT – Wave (4) higher-low 💪
• 0.0875 USDT – 4H trendline resistance ⚠️
• 0.0877–0.0880 USDT – resistance zone (former support)
• 0.0901 USDT – first profit zone 🔥
• 0.0925–0.0930 USDT – Wave (5) extension 🎯
4️⃣ Indicators
• 4H MACD: still slightly negative but histogram flattening → bears weakening
• 1H MACD: just crossed bullish → short-term upside momentum ✅
• If 1H MACD stays positive as price hits 0.0875, expect a quick breakout
5️⃣ Trade Plan
• Entry: Wait for a 4H candle close above 0.0875 USDT. Confirm on 1H that price stays above.
• Long near 0.0877–0.0880 USDT.
• Stop Loss under 0.0855 USDT (below Wave (4) at 0.0862).
• TP 1: 0.0901 USDT (take 50% off).
• TP 2: 0.0925–0.0930 USDT (exit remaining).
6️⃣ Invalidation
If price closes below 0.0831 USDT on 4H, the bull count fails. Risk shifts down toward 0.0796 USDT. 🚨
7️⃣ Aggressive Entry (ADHD-Friendly Tip)
• Start a small long at 0.0862–0.0864 USDT (Wave (4)).
• Tight stop under 0.0855 USDT.
• Add more once 0.0877 USDT flips.
8️⃣ Quick Signals to Watch
• 4H close > 0.0875 USDT → GO! 🟢
• 1H candle stays above 0.0875 USDT → Confirm!
• 1H MACD histogram positive → Keep it rolling!
9️⃣ Bullmaster Conclusion
“KAS/USDT shows textbook 5-wave structure off the 0.0831 pivot. With a higher-low into 0.0862 and bullish MACD on the 1 hour, the path of least resistance is up, provided we break the 4 hour descending trendline at 0.0875–0.0880. Our first target is 0.0901, where momentum may pause, but a sustained rally could carry us into the 0.0925–0.0930 zone. A stop under 0.0855 protects the setup—bulls look ready to flip control.”
🔟 Next 8 Hours (Zoomed-In OR in a nutshell )
• Watch for 1H MACD staying green → fuels the bounce into 0.0875
• If 1H price holds > 0.0875, it’s a go→ 0.0901 then 0.0925!
• If price dips back under 0.0862 on 1H → abort mission; bears still in charge.
Let’s keep it simple, stay focused, and ride those bullish waves! 🌊🐂✨
KASUSDT trade ideas

TECHNICAL ANALYSIS – KASPA/USDT (Daily Chart) + TRADE PLANTECHNICAL ANALYSIS – KASPA/USDT (Daily Chart)
Chart Pattern & Price Action:
Descending Channel (Falling Wedge): KASPA has been trading within a falling wedge pattern, typically a bullish reversal setup.
Breakout Zone Approaching: Price is currently testing the upper resistance of the wedge (~$0.086–$0.088). A breakout from this level may indicate trend reversal.
Key Resistance Zone:
$0.105 – $0.127: Significant supply area (marked in red). Previously rejected, it is the next target if price breaks out upward.
Support Zone:
$0.073 – $0.082: Demand zone. Coincides with the Bollinger Band lower range and historical support.
Indicators Overview:
Bollinger Bands:
Price is trading at or near the middle band, showing a neutral-to-slightly bearish bias.
A breakout above the upper band (~$0.0895) could trigger bullish momentum.
MACD (VMC Cipher_B_Divergences):
Strong bearish momentum continues, but we can observe potential bullish divergence forming.
Green dot signal at the bottom may indicate a possible local bottom.
RSI (Relative Strength Index):
Currently at 37.06, near oversold territory.
Could signal a bounce if RSI climbs above 40 and confirms strength.
Money Flow Index (Art’ Money Flow):
MFI is deep in negative; however, these levels often precede trend reversals.
Watch for a crossover into positive territory as confirmation.
Stochastic RSI:
Bullish crossover around 14.53 / 15.67 in the oversold zone.
Early sign of potential short-term bounce.
TRADING PLAN
Entry Points:
Zone Type Price Range Reason
Buy Spot 1 Conservative $0.073 – $0.082 Strong historical support & bottom of wedge
Buy Spot 2 Aggressive ~$0.086 – $0.089 Breakout of descending wedge
Buy Spot 3 Momentum Break above $0.105 Bullish confirmation + breakout of major resistance
Take Profit Zones:
TP Level Price Notes
TP1 $0.105 First resistance / psychological level
TP2 $0.127 Strong resistance – expect rejection here
TP3 $0.15–0.16 Major extension target if strong momentum
Stop-Loss Strategy:
Strategy Type Placement
Conservative Below $0.073
Aggressive Below $0.080
Risk Management:
Use position sizing relative to account size (e.g., 1–3% risk per trade).
Adjust stop-loss dynamically if entering at breakout.
Combine with on-chain metrics or volume spikes for higher conviction.
SCENARIOS:
🔼 Bullish Scenario (Blue Up Arrow):
Breakout above wedge → retest → rally toward $0.105+
Break $0.105 confirms macro uptrend continuation
🔽 Bearish Scenario (Blue Down Arrow):
Rejection at wedge top → breakdown of $0.082 → revisit $0.073 support
Below $0.073 would invalidate short-term bullish structure

$KASUSDT Breaks Trendline CRYPTO:KASUSD Breaks Trendline
Kaspa KASUSDT has broken out of the downtrend and bounced strongly from the key support zone.
Price reclaimed the demand area and is now aiming for the $0.114060 resistance.
As long as it holds above $0.085916, the bullish setup remains valid. Invalidation is below $0.082460.
DYRO, NFA

Technical Analysis – KASPA/USDT (1D) + spot trade planTechnical Analysis – KASPA/USDT (1D)
Trend Structure & Price Action
KASPA experienced a strong bullish rally (highlighted in orange) starting in mid-April, followed by a descending channel (bullish flag) correction (highlighted in green).
Currently, the price is approaching major support zones, indicating a potential reversal opportunity.
Support & Buy Zones (Marked)
Buy Spot 1: ~$0.062–$0.067 → Key historical support, potential bottom range.
Buy Spot 2: ~$0.070–$0.075 → Moderate support, former resistance turned support.
Buy Spot 3: ~$0.078–$0.081 → Current local demand zone and trendline interaction.
These zones represent incremental buying opportunities during correction.
Indicator Analysis
Market Cipher / Divergence Indicators
Multiple bullish divergence signals are forming (green dots), suggesting buyer interest is growing.
Momentum is in deep negative territory and may be bottoming.
RSI (14)
RSI is at 32.95, which is approaching oversold territory (below 30), signaling a potential reversal.
Money Flow Index (MFI)
MFI is at 19, which is also considered oversold, showing capital is leaving but likely nearing exhaustion.
Stochastic RSI
Stochastic RSI is below 10 (6.22) and starting to cross, indicating a strong potential bullish reversal in the short term.
Trading Plan – KASPA/USDT (Spot Strategy)
Entry Strategy (DCA)
Buy Spot Entry Range Allocation Reason
Spot 1 $0.062 – $0.067 50% Major long-term support, deep oversold zone
Spot 2 $0.070 – $0.075 30% Mid-range support, confirmation zone
Spot 3 $0.078 – $0.081 20% Early entry for aggressive traders
Risk Management
Stop Loss (optional): Below $0.060 (break of long-term structure)
Average Entry (if all 3 zones are filled): ~$0.071 (estimated)
Capital Allocation: Use max 3–5% of total capital per setup for risk control.
Profit Targets
Target Level Price Rationale
TP1 $0.092 – $0.095 Top of descending channel
TP2 $0.105 Previous swing high (April peak)
TP3 $0.120 Breakout and continuation target
KASPA is currently in a healthy correction within a bullish continuation pattern (falling channel). The confluence of oversold indicators (RSI, MFI, Stoch RSI), support zones, and bullish divergence suggests a favorable buying opportunity for swing or position traders. If the price respects these zones, a bounce toward the prior high or breakout levels is likely.

KASPA wave C of Expanding Flat. Bullish!This is my bullish elliott wave scenario for kaspa, currently beginning wave 3/3/5 of wave C so should be a nice ride up to clear our extreme of wave A at 0.12012. Conservative invalidation at the bottom of wave B 0.10159. THIS IS NOT FINANCIAL ADVICE. Its simply my opinion based on Elliott Wave Theory

KASPA CUP AND HANDLE (TA+TRADE PLAN)Cup and Handle pattern clearly formed with rounded bottom and emerging handle.
This is a strong bullish continuation pattern suggesting a potential breakout once the handle completes.
The neckline resistance is approximately at $0.12, and a breakout above this could trigger a strong upward move.
Support & Resistance Zones (S/R)
Current Price: $0.10895
Major Resistance Levels:
$0.12 (neckline)
$0.14
$0.16
$0.19 (pattern target)
Major Support Levels:
$0.10
$0.085
$0.065
Volume Analysis
Volume increased during the formation of the right side of the cup – a bullish signal.
Volume has decreased slightly during handle formation, which is expected.
Indicators
RSI (14): 52.89 – Neutral zone. Not overbought or oversold. Room for upward movement.
Stochastic (14, 3, 1): 27.76 – Close to oversold; potential bullish crossover incoming.
Money Flow Index (MFI): 62 – Healthy inflow of money, not overbought yet.
Wave Momentum/Cipher B: Shows bullish divergences and momentum building from recent lows.
Price Target (Pattern Projection)
Cup depth: ~$0.12 - $0.06 = $0.06
Breakout target: $0.12 + $0.06 = $0.18–0.19 zone
📈 Trading Plan – KASPA/USDT
Strategy: Cup and Handle Breakout
Entry
Aggressive Entry: Buy near current price ($0.108–$0.11) if expecting early breakout.
Conservative Entry: Buy on confirmed breakout above $0.12 with strong volume (daily close).
Stop-Loss
Place SL below handle low, approx. $0.096–$0.098 (depending on risk tolerance).
Alternative: wider SL below $0.085 support if aiming for longer-term hold.
Take Profit Levels
TP1: $0.14
TP2: $0.16
TP3: $0.19 (pattern target)
Use laddered take-profits for partial exits at each level.
Risk Management
Risk per trade: 1–2% of capital
Use position sizing calculator to adjust size based on SL distance
🔄 Re-entry Plan
If breakout fails, monitor $0.085–0.095 zone for support and potential re-entry on double-bottom or bull flag.
⚠️ Bearish Scenario
Breakdown below $0.085 invalidates cup and handle.
Next support at $0.065.
Reassess structure and macro sentiment.

KAS (Kaspa) – Long Swing Setup from Key SupportKAS is retracing into a key support zone around $0.108, which has previously acted as a springboard for bullish reversals. This level aligns with a potential higher low structure on the daily chart, and offers a favorable risk/reward setup for a swing long.
🔹 Entry Zone:
$0.108
🎯 Take Profit Targets:
🥇 $0.13 – $0.154
🥈 $0.175 – $0.19
🛑 Stop Loss:
Just below $0.097 (breakdown below support invalidates setup)

KASPA (KASUSDT) Technical Analysis, 1D Chart KUCOIN + trade planKASPA (KASUSDT) Technical Analysis — 1D Chart by Blaž Fabjan
Date: May 19, 2025
Exchange: KUCOIN
Pair: KAS/USDT
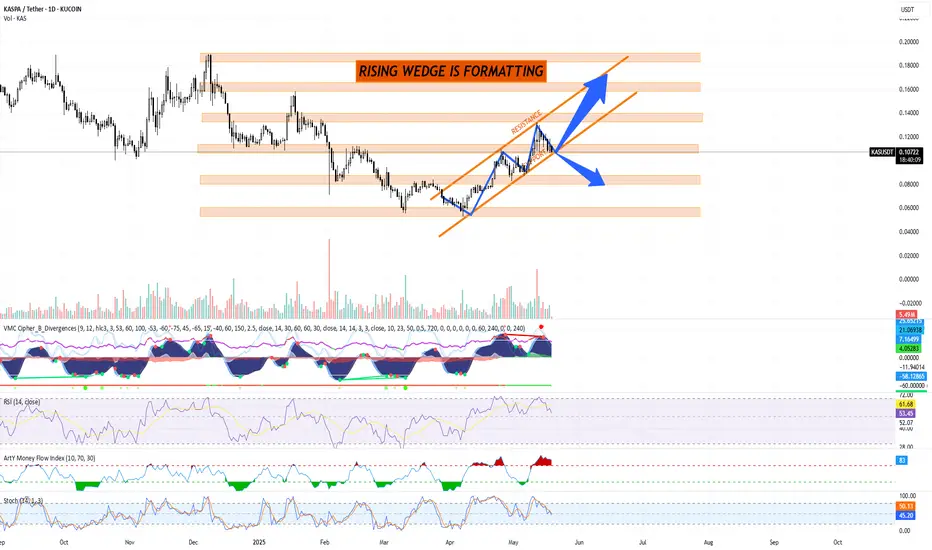
Chart Pattern: Rising Wedge (Bearish Reversal Signal)
A rising wedge is currently forming — characterized by converging trendlines sloping upward.
Support and Resistance levels are clearly outlined in the orange zones.
This pattern often signals a potential breakdown, but an upward breakout is possible with strong momentum.
Key Technical Indicators
1. Volume
Recent volume surge on uptrend suggests buying interest, but declining volume into the wedge tip hints at a possible exhaustion.
2. VMC Cipher B Divergences
Signs of bearish divergence forming; red dots and momentum wave flattening may signal weakening bullish strength.
3. RSI (14)
RSI at 53.27: In neutral territory. Slight bearish divergence observed from recent peaks. Watch for a move below 50 as a confirmation of bearish pressure.
4. Money Flow Index (MFI)
MFI at 83 (overbought zone): Indicates that buying pressure may soon fade, increasing the probability of a correction.
5. Stochastic RSI (14, 3, 3)
Stochastic RSI near 44–49 and crossing downward: Signaling a potential short-term correction.
Key Support & Resistance Zones
🟧 Resistance Levels:
$0.12 – $0.14 (current wedge resistance zone)
$0.16 – $0.18 (next target on bullish breakout)
$0.20+ (major resistance if trend continues)
🟧 Support Levels:
$0.10 (critical support)
$0.08 – $0.09 (wedge breakdown target)
$0.065 – $0.07 (strong demand zone)
Trading Plan for KASPA (KAS/USDT)
Bullish Scenario (Breakout Upwards)
Entry: Above $0.115 with strong volume confirmation
Targets:
TP1: $0.14
TP2: $0.165
TP3: $0.20
Stop-Loss: Below $0.10 (to invalidate wedge structure)
Bearish Scenario (Breakdown)
Entry: Below $0.10 (support break)
Targets:
TP1: $0.085
TP2: $0.072
TP3: $0.065
Stop-Loss: Above $0.11
Neutral/Range Strategy
If KAS trades between $0.10–$0.115 with low volume:
Avoid entry.
Wait for breakout or breakdown confirmation.
Risk Management
Risk/Reward Ratio: Minimum 2:1
Capital Allocation: Max 2–3% of portfolio per trade
Use limit orders to control entry points, especially due to high volatility in crypto markets.
The rising wedge pattern is often a precursor to downside in crypto.
However, macro bullish news, network upgrades, or volume surges may invalidate the bearish setup.
Traders should remain flexible and monitor volume, RSI, and support zones for any signs of reversal.
Kaspa Technology Review & Investment InsightsIn this video, I share my review of Kaspa’s technology and offer some thoughts on its potential as an investment opportunity.
I walk through a live demonstration of DAGKnight in production, and highlight key aspects of Kaspa’s speed, security, and scalability—three pillars that set it apart from traditional blockchain architectures.
If you’d like to dive deeper, here are some great resources to explore:
📄 Whitepaper: eprint.iacr.org
🧠 DAGKnight Production Graph Inspector: kgi.kaspad.net
📊 Kaspa Key Stats Dashboard: kas.fyi

KASUSDTKASUSDT is currently presenting a compelling short opportunity based on the 1-hour timeframe.
After a clear rejection from the 0.12686 high, the market has formed a lower high structure and is consolidating just below a well-defined supply zone at 0.12202 – 0.12400. This area has acted as strong resistance multiple times, showing signs of supply absorption failure.
The current price action is showing signs of buyer exhaustion, and we’re seeing consistent lower highs in the structure, with liquidity being built above the 0.122 zone.
With entry : 0.12202 – 0.12400
• Stop-Loss: 0.12686 (above the previous swing high/liquidity grab)
• Take-Profit: 0.11013 (previous demand zone + structural support)

Kaspa 2025/26 Bull Market Signals ConfirmedKaspa peaked in July 2024. It went bearish until April 2025. A total of 274 days, a little more than nine months.
When in doubt, read a book.
When looking at this chart with the log. scale on it might seen like the correction didn't do much, but indeed it did. KASUSDT went as low as the 0.786 Fib. retracement level in relation to the action between May 2023 and July 2024. The correction reached more than 74%. That is, -74%. A drop this big and lasting this long.
The market always looks for balance. Once the bearish wave is over we get a bullish wave.
The market always seeks balance. Corrections tend to be shorter and smaller than bull markets. So, if the market went down for 9 months, for how long do you think it will grow?
April 2025 was bearish but only at first. Last month ended up closing green.
April produced the lowest prices since November 2023 but then recovered and closed green. A bullish reversal signal but needs confirmation. This month we are up and full green, confirmation confirmed.
This all means that the bulls are in. The market is changing or already changed.
Remember, I told you it would take the masses until late May to figure out what was really happening; extreme bullishness, we are only weeks away. Come late May 2025 and there will be no doubt, every now knows that Crypto is going up. Kaspa is no exception, prepare for massive growth.
Namaste.

$Kas #Kaspa still running BullishWe have broken the 0.09242 level and now seem to have that as support in the bullish move upwards.
We touched 0.10903 but we need to break and hold it for a new upwards trend support level.
Interesting times for CSE:KAS

Kaspa Update, Including Targets (PP: 344% & 496%)If you are a Kaspa trader, holder or lover, let me start by saying that the chart looks great. It looks awesome to say the least.
Looking at the red dashed line on the chart, we can see that KASUSDT produced a perfect bottom and is now on the bullish zone.
Looking at the blue line, both the horizontal line and EMA21, we can see this week is breaking above a strong resistance level, the lows matching 4-November and 29-April from 2024. This weekly candle is also full green and trades at the highest price since February.
Ok, now that the basics are in, let me take some time for a greeting...
Good afternoon my fellow Cryptocurrency trader, how are you feeling in this wonderful day?
Now that EMA21 weekly is being conquered as resistance, bullish growth is about to be fully confirmed.
The signals are in. The Altcoins are bullish and this we already know long ago. Bitcoin is trading safely and strongly above 100K and once Bitcoin becomes strong, the Altcoins follow; Kaspa is set to grow.
We have several targets on the chart. The certainty level for a bullish wave is high, 100%. First target is easy and should be ignored, 0.148 and 0.174, these are too easy so we aim higher.
New ATH is set at the 1.618 Fib. extension sitting at 0.303. This is a good target but still easy. The next target is 0.458 and that's a target where we should consider taking some profits but, it can go higher and it is very likely to go much higher.
Thanks a lot for your continued support.
I hope that you enjoy the content.
Namaste.

KAS – Long Spot Trade Setup (Structural Recovery in Play)KAS is beginning to show early signs of reversal, reclaiming the 20-day SMA after forming a double bottom near the $0.087 zone. This signals a potential shift in momentum and offers a favorable risk-reward opportunity.
🔹 Entry Zone:
$0.087 – $0.094
🎯 Take Profit Targets:
🥇 $0.108 – $0.120
🥈 $0.133 – $0.154
🛑 Stop Loss:
Just below $0.080

#KAS/USDT Analysis📈#KAS/USDT Analysis📈
CSE:KAS breaks the Diagonal Trendline, waiting for this Daily +OB to be tapped which is align with OTE and Premium and Discount zone to long.
🔑 Levels to Watch:
Resistance: PMH $0.10920
Support: PWL $0.078

KASPA Structure Analysis – Downtrend BreakoutAfter retesting the $0.05 demand zone (previous resistance dating back to August 2023), BITGET:KASUSDT reclaimed the 50-day EMA (yellow) and tested the 200-day EMA (orange), before a brief pullback with the 50-day EMA acting as support.
Key Levels
• $0.050-$0.060: Main demand zone
• $0.083: Current support, reinforced by 50-day EMA
• $0.105: Current resistance, reinforced by 200-day EMA
• ~$0.120: HVN and potential resistance
• $0.155-$0.160: HVN, previous S/R and potential resistance
• $0.180-$0.200: Main supply zone
Here's a weekly chart with volume profiles for more context:
Considerations
• The breakout from the recent downtrend, and the break above the 50-day EMA followed by a retest as support, is a good sign for the bulls.
• If the 200-day EMA is successfully reclaimed, it could offer a good shot at retesting the main supply zone in the $0.180-$0.200 area.
• Conversely, a sustained break back below the 50-day EMA could lead to another test of the $0.050-$0.060 main demand zone.
Neutral outlook until a break above 200-day EMA or below 50-day EMA.

$Kaspa Bullish sentiment Can we break and hold 0.10903
If so it’s a nice base to use as support going into Crescendo going live and smart contract implementation later this year CSE:KAS #Kaspa

Kaspa Bullish Signal Revealed —Focus On The Long-TermKaspa just broke decisively above EMA55 on the daily timeframe, opening up two major targets for this current advance and confirming at least 3 months of growth for this bullish wave and period.
Now, every time a strong resistance level is hit, there is a retrace.
When a strong move happens, there is a pause.
The market never moves up, up, up unless it is in a bull run phase. The market also never moves straight down; the market moves in waves.
So it is natural to see a pause after a strong bullish breakout. After several days of pause, we get additional growth.
Look at the bigger picture, consider this; From the 7-April low to yesterday's high Kaspa is up by 89%. You see? Nice growth and this growth will continue long-term, but long-term.
You can be certain that the market will produce higher highs and higher lows, but this does not remove the possibility of flash crashes and shakeouts, in fact, these type of moves are part of normal market behavior, not the exception but the norm.
When people see strong bullish action they tend to rush, jump and buy-in. They don't buy when prices are low but when the breakout happens out of excitement, an impulse.
What happens is that the market stops and go bland for a few days. This impulse dies out and these people close the trade at lower prices, and then the market resumes growing.
You can do good; you simply wait/hold and it will grow.
You should buy when I publish my charts. If you bought out of excitement, focus on the long-term. FOCUS ON THE LONG-TERM.
Thanks a lot for your continued support.
Namaste.

KSPAusdt | Long Setup Forming | Post-Correction | (April 2025)KSPAusdt | Long Setup Forming | Watching Support Zone Post-Correction | (April 23, 2025)
1️⃣ Short Insight Summary:
KSPAusdt has shown strength previously, but with a potential correction across the broader market (especially Bitcoin), I'm now watching for a lower entry. If the setup confirms, this could be a great spot for a bounce.
2️⃣ Trade Parameters:
Bias: Long (after potential correction)
Entry Zone: Watching around $0.083 for a potential entry
Stop Loss: Floating stop around $0.062 (below key support)
TP1: $0.10
TP2: $0.11
TP3: $0.15
TP4: $0.18
Partial Exits: Around $0.12 for safety — the rest can be left to run if momentum continues
✅ Risk-Reward Ratio: Variable depending on execution, but designed with solid risk control in mind
3️⃣ Key Notes:
📉 With Bitcoin showing signs of a pullback, I’m holding off on immediate entries. A deeper correction in BTC could pull KSPAusdt lower into my ideal entry zone.
📊 If the market turns bullish again, KSPA has room to push up toward previous targets.
This setup is not active yet — it’s more of a plan to act on if price visits the target zone around $0.083 and shows bullish confirmation.
4️⃣ Optional Follow-up Note:
I’ll revisit and update this idea if the market shifts or if KSPA reaches the target zone with bullish signs.
Please LIKE 👍, FOLLOW ✅, SHARE 🙌 and COMMENT ✍ if you enjoy this idea! Also share your ideas and charts in the comments section below! This is best way to keep it relevant, support us, keep the content here free and allow the idea to reach as many people as possible.
Disclaimer: This is not financial advice. Always conduct your own research. This content may include enhancements made using AI.

Trading opportunity for KASUSDTBased on technical factors there is a Sell position in :
📊 KASUSDT
🔴 Sell Now
🪫Stop loss 0.11000
🔋Target 0.06767
📏 R/R 2
💸RISK : 1%
We hope it is profitable for you ❤️
Please support our activity with your likes👍 and comments📝

kaspa bouncekaspa is going to retest previous support at around 10 cents after this double bottom and nice bullish divergence there is a lot of confluence of resistance around 10 cents, i expect to get rejected and retest the breakout of double bottom before trying at 10 cents again. could be a decent short.

Kaspa still looking strong... however....KAS has gotten some follow-through since the last update. The price is now hitting local resistance. At this point, we are hoping for a breakout and a confirmation of a higher high. The good news is that momentum is not oversold yet. Short-term bearish responses can be good levels for DCA.
Full TA: Lin in the BIO

Kaspa $Kas daily chart Current thoughts on Kaspa CSE:KAS daily chart
📊- 0.08261 Next resistance level, could become support if broken and held.
📊- 0.10903 Mid key level, will need to be broken, held and used in a push back towards ATH
📊- 0.15396 String bearish level, If broken and turned to support could be a key level in the future as support for a run to new ATH’s
📊- 0.18845 The lower high that needs breaking before we look towards ATH areas. Not much in between this level and the 0.20791 we all want to see broken in 2025 -
